Ontogenetic Transformations in Neurocranium and Skeletal Shapes of Various Fish Species
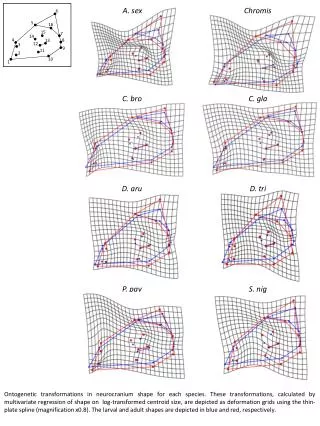
This study explores the ontogenetic transformations in neurocranium, suspensorium, opercle, mandible, and premaxilla shapes of several fish species, including A. sexchromis, C. bro, C. gla, D. aru, D. tri, P. pav, and S. nig. Transformations were quantified through multivariate regression of shape on log-transformed centroid size and visualized using thin-plate spline deformation grids. The larvae and adult shapes are differentiated, with larval shapes depicted in blue and adult shapes in red, highlighting the morphological changes that occur during development.

Ontogenetic Transformations in Neurocranium and Skeletal Shapes of Various Fish Species
E N D
Presentation Transcript
A. sex Chromis 6 5 16 15 7 14 4 8 13 12 3 9 11 2 10 1 C. bro C. gla D. aru D. tri P. pav S. nig Ontogenetic transformations in neurocranium shape for each species. These transformations, calculated by multivariate regression of shape on log-transformed centroid size, are depicted as deformation grids using the thin-plate spline (magnification x0.8). The larval and adult shapes are depicted in blue and red, respectively.
5 7 4 A. sex Chromis 6 3 1 2 8 11 12 10 9 C. bro C. gla D. aru D. tri P. pav S. nig Ontogenetic transformations in suspensorium & opercle shape for each species. These transformations, calculated by multivariate regression of shape on log-transformed centroid size, are depicted as deformation grids using the thin-plate spline. The larval and adult shapes are depicted in blue and red, respectively.
2 3 8 4 11 10 9 1 5 6 12 7 A. sex Chromis C. bro C. gla D. tri D. aru P. pav S. nig Ontogenetic transformations in mandible shape for each species. These transformations, calculated by multivariate regression of shape on log-transformed centroid size, are depicted as deformation grids using the thin-plate spline (magnification x0.6). The larval and adult shapes are depicted in blue and red, respectively.
2 A. sex Chromis 3 4 5 6 1 C. bro C. gla D. aru D. tri P. pav S. nig Ontogenetic transformations in premaxilla shape for each species. These transformations, calculated by multivariate regression of shape on log-transformed centroid size, are depicted as deformation grids using the thin-plate spline. The larval and adult shapes are depicted in blue and red, respectively.