Download
1 / 3
30 likes | 87 Views
Respiration rate (nmol O 2 /min/mg protein). Succinate ( mM ).

E N D
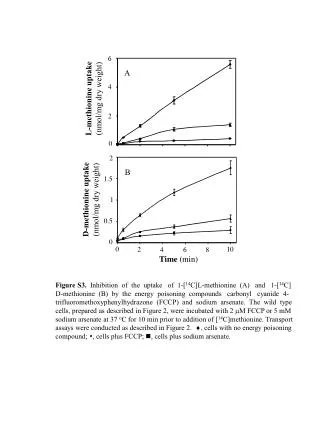
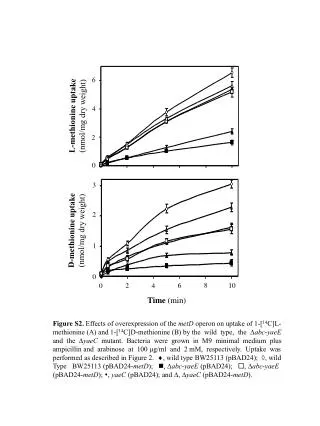
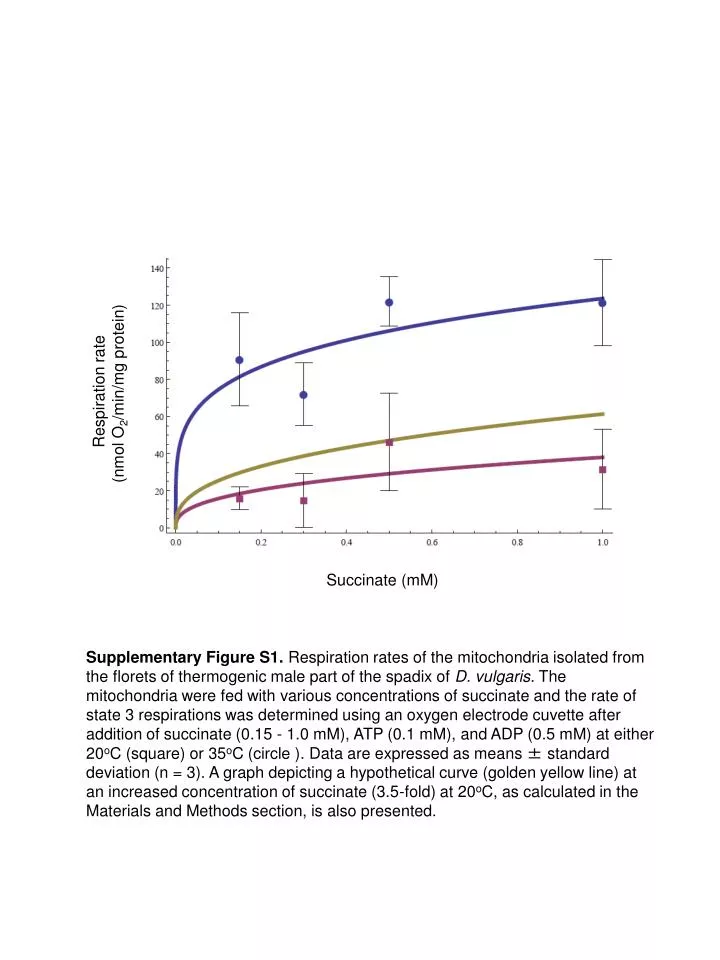
Respiration rate (nmol O2/min/mg protein) Succinate (mM) Supplementary Figure S1.Respiration rates of the mitochondria isolated from the florets of thermogenic male part of the spadix of D. vulgaris. The mitochondria were fed with various concentrations of succinate and the rate of state 3 respirations was determined using an oxygen electrode cuvette after addition of succinate (0.15 - 1.0 mM), ATP (0.1 mM), and ADP (0.5 mM) at either 20oC (square) or 35oC (circle ). Data are expressed as means ± standard deviation (n = 3). A graph depicting a hypothetical curve (golden yellow line) at an increased concentration of succinate (3.5-fold) at 20oC, as calculated in the Materials and Methods section, is also presented.
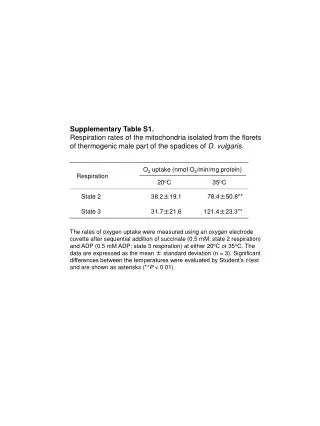
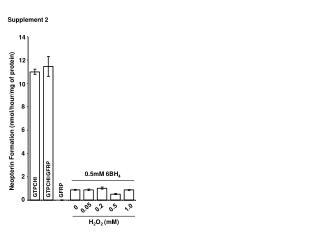
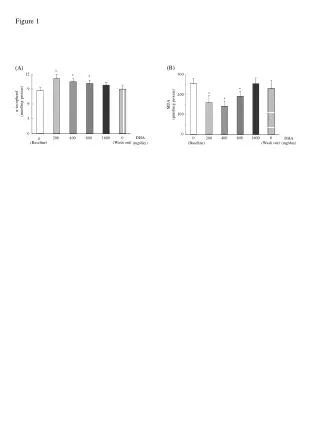
** NS Supplementary Figure S2.Respiration rates of the mitochondria isolated from the florets of thermogenic male part of the spadix of D. vulgaris. Rates of oxygen uptake were determined using an oxygen electrode cuvette at 20oC or 35oC after sequential addition of the indicated compounds at the following final concentrations: 1 mM succinate, 0.5 mM ADP, 0.5 mM KCN, 10 mM pyruvate, and 0.1 mM n-propyl gallate. The data are expressed as the mean ± standard deviation (n = 3). Significant differences between cyanide resistant respiration and pyruvate-activated respiration were evaluated by Student’s t-test and are shown as asterisks (**P < 0.01). NS: not significant.
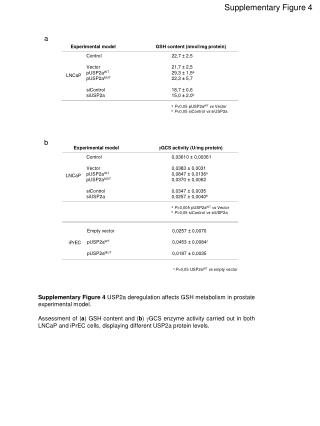
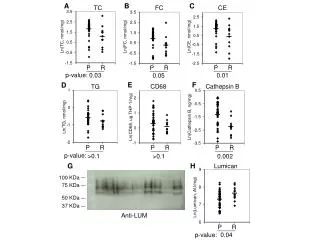
MV (kDa) 95- 72- 55- 43- A B 34- 269-DIESGVIQDSPAPAIALDYWR-290 26- 17- 10- m/z C Supplementary Figure S3. Identification of DvAOX-specific peptide in the mitochondria purified from the florets of thermogenic male part of the spadix of D. vulgaris. (A) Western analysis of mitochondrial protein. An aliquot of protein (10 mg) was separated by SDS-PAGE, visualized by the Coomassie brilliant blue staining, transferred to a polyvinylidene difluoride membrane, and incubated with AOA monoclonal antibody. A band corresponding to the position of the AOX protein (denoted by a square box) was excised and analyzed by nano LC–MS/MS. The positions of the molecular mass standards (MW) are shown on the left of the panel. (B) MS/MS spectrum of the DvAOX1-specific peptide fragment (DIESGVIQDSPAPAIALDYWR) derived by tryptic digestion of the protein sample. Additional information concerning DvAOX-specific peptides is presented in Supplemental Table S3. (C) Sequence coverage of the DvAOX protein analyzed by nano LC–MS/MS. Amino acid sequences identified from a MASCOT database search are indicated in red, and the DvAOX1-specific peptide is underlined. 1 MSSRLAGTAL CRQLSHVPVP HLPVLRPTAG CSAATAQRAG LWPPSWFSPP 51 RRASTLSDPAQDGGKKKAGTAGKVPPGEGGGGGEQKAVVS YWGVPPSRVS 101 KEDGSEWRWT CFRPWDTYQA DLSIDLQKHHAPTTILDKLA LCTVKALRWP 151 TDIFFQRRYA CRAMMLETVA AVPGMVGGVV LHLKSLRRFE HSGGWIRALL 201 EEAENERMHL MTFMEVAQPR WYERALVLAV QGVFFNAYFL GYLLSPKFAH 251 RVVGYLEEEA IHSYTEFLKD IESGVIQDSP APAIALDYWR LPQGSTLRDV 301 VTVVRADEAH HRDVNHFASD VHYQGLELKTTPAPLGYH