Impact of USP2a Deregulation on GSH Metabolism in Prostate Cells
10 likes | 84 Views
Experimental study evaluating GSH content and γGCS enzyme activity in LNCaP and iPrEC cells with varying USP2a levels. Results suggest USP2a influences GSH metabolism in prostate cells.

Impact of USP2a Deregulation on GSH Metabolism in Prostate Cells
E N D
Presentation Transcript
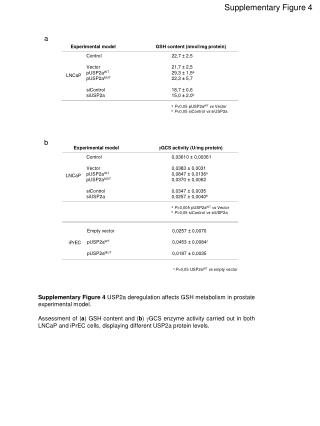
Supplementary Figure 4 Experimental modelGSH content (nmol/mg protein) a • Control 22,7 ± 2,5 • Vector 21,7 ± 2,5 • pUSP2aWT 29,3 ± 1,5a • pUSP2aMUT 22,3 ± 5,7 • siControl 18,7 ± 0,6 • siUSP2a 15,0 ± 2,0b • aP<0,05 pUSP2aWTvs Vector • bP<0,05 siControl vs siUSP2a LNCaP b Experimental model GCS activity (U/mg protein) Control 0,03610 ± 0,00361 Vector 0,0383 ± 0,0031 pUSP2aWT 0,0847 ± 0,0136a pUSP2aMUT 0,0370 ± 0,0062 siControl 0,0347 ± 0,0035 siUSP2a 0,0257 ± 0,0040b aP<0,005 pUSP2aWTvs Vector bP<0,05 siControl vs siUSP2a LNCaP Empty vector 0,0257 ± 0,0070 pUSP2aWT 0,0453 ± 0,0084c pUSP2aMUT 0,0187 ± 0,0035 c P<0,05 USP2aWTvs empty vector iPrEC Supplementary Figure 4 USP2a deregulation affects GSH metabolism in prostate experimental model. Assessment of (a) GSH content and (b) GCS enzyme activity carried out in both LNCaP and iPrEC cells, displaying different USP2a protein levels.