Download
1 / 14
140 likes | 256 Views
Spectral Analysis based on the Adjacency Matrix of Network Data. Leting Wu Fall 2009. Mathematical Representation of Networks Data. Adjacency Matrix A If there is a link between vertexes i and vertex j, a ij =1(or positive number if it is a weighted adjacency matrix) otherwise 0

E N D
Spectral Analysis based on the Adjacency Matrix of Network Data Leting Wu Fall 2009
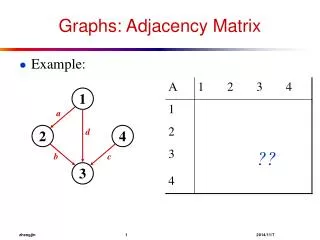
Mathematical Representation of Networks Data • Adjacency Matrix A • If there is a link between vertexes i and vertex j, aij=1(or positive number if it is a weighted adjacency matrix) otherwise 0 • Laplacian Matrix L • One definition: L = D – A, D = diag{d1, d2,…, dn} • Another definition: L = CC’, C is the incidence matrix with rows labeled by vertex and columns labeled by edges
Eigen Decomposition • Normal Matrix N • N = D^(-0.5) A D^(-0.5) Eigenvectors can be served as a ranking index on the nodes
An Example of Two Clusters Network of US political books(105 nodes, 441 edges) Books about US politics sold by Amazon.com. Edges represent frequent co-purchasing of books by the same buyers. Nodes have been given colors of blue, white, or red to indicate whether they are "liberal", "neutral", or "conservative".
Properties of the Spectral Space of A • Two/k clear clusters construct two/k orthogonal half lines in the spectral space in two/k dimensional space • The larger the distance is a node from the original, the more important the node is: it could have very large degree or connect with some nodes of large degree • Bridge points are between the smaller angle formed by the half lines
Spectral Clustering Methods • Ratio Cut: Find the clusters by minimizing the cut cost • The eigen-decomposition of Laplacian Matrix offers a heuristic solution: In 2-way cluster, the second smallest eigenvalue is the cut cost its corresponding eigenvector is the cluster indicator: xi>0 is one cluster, xi<0 is another, xi=0 is the bridge between two clusters
Spectral Clustering Methods • Ratio Cut: Find the clusters by minimizing the cut cost • Normalized Cut: Find the clusters by minimizing the modified cut cost • The eigen-decomposition of Normal Matrix offers a heuristic solution: In 2-way cluster, the second largest eigenvalue is 1 - cut cost and its corresponding eigenvector is the cluster indicator: xi>0 is one cluster, xi<0 is another, xi=0 is the bridge between two clusters
A Different Spectral Clustering Method by Adjacency Matrix • Define the density D(G) of the graph as (# of edges within the community - # of edges across the community)/# of nodes, we want to find the clusters with high desity: • The eigen-decomposition offers the heuristic solution: Eigenvalue is D(G) and the corresponding eigenvector is the cluster indicator
2-way clustering • The first eigenvalue and eigenvector are always positive with positive weighted adjacency matrix by Perron–Frobenius theorem. • 2-way clustering has two situations here: • 2 clearly clusters: when the eigenvector of the largest eigenvalue contains zeros:
Cont. • 2 mixed clusters: when no zeros in the first eigenvector • If the second largest eigenvalue in magnitude is positive, the graph contains two major communities. For xi>0 there is one community and xi<0 is another community • If the second largest eigenvalue in magnitude is negative, the graph is bipartite. For xi>0 there is one cluster and xi<0 is another cluster • K-way is a straight forward extension
Experiment Results • Political Books: 105 nodes 92 labeled Label Label LabelA L N • Political Blogs: 1222 nodes labeled into two groups Label Label LabelA L N
Conclusion • There is much information containing in the adjacency matrix which can be used to the clustering, ranking and visualization of networks • We propose a clustering method based on graph density and some experiment results show that this method works better than those based on L and N for some datasets