Download
1 / 32
320 likes | 428 Views
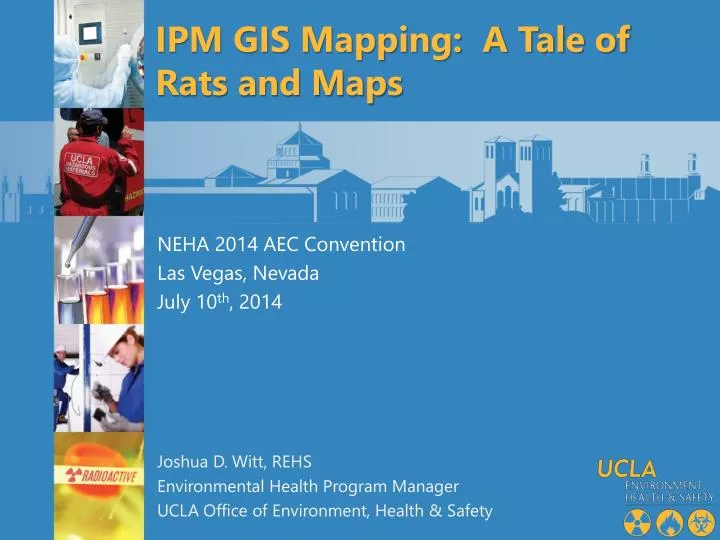
IPM GIS Mapping: A Tale of Rats and Maps. NEHA 2014 AEC Convention Las Vegas, Nevada July 10 th , 2014. Joshua D. Witt, REHS Environmental Health Program Manager UCLA Office of Environment, Health & Safety. UCLA. Founded Students Faculty & Academic Staff Staff Personnel

E N D
IPM GIS Mapping: A Tale of Rats and Maps NEHA 2014 AEC Convention Las Vegas, Nevada July 10th, 2014 Joshua D. Witt, REHS Environmental Health Program Manager UCLA Office of Environment, Health & Safety
UCLA Founded Students Faculty & Academic Staff Staff Personnel Total Campus Population Acres People/Acre Number of UC Campuses UCLA Population Density 1919 41,341 10,875 31,262 83,478 419 199.2 10 #1
Our assumptions • UCLA will always have a baseline population of rodents due to the following factors:
Sections include: Building name Bait station number Location Status/condition Media Pictures Map of station status Bait station analysis
Number of rodent reports 2008: 181 Average 2009-2013: 59.6 Year -67%
What is a bait station? Open Closed
In short: • Where should we reallocate our rodent bait stations and focus our IPM energy to prevent rodent infestations?
What does GIS mean to us? • Our working definition is: Addressing a complex problem using intersecting information to create solutions
What are our overarching goals? • Optimize our bait station placement to reduce unnecessary rodenticide • Demonstrate the viability and usefulness of the GIS project to: • Improve campus Integrated Pest Management • Increase stakeholder focus and cooperation • Advocate for situation-appropriate resources
What is GIS? • Visualize • Question • Analyze • Interpret
How did we do it? • Program used: ESRI ArcGIS version 10.1 • To be compatible with UCLA GIS-users • Why is that important? • We need their data and…
UCLA Interactive Map: What Could Be
Which buildings are serviced by EH&S? • 116/265 buildings (~44%) • We do not service medical center or housing business units
Trash Cans • # of trash cans: 616 • Trash cans are not rodent proof
Age of Building • Demarcated by 10 year increments • Shows susceptibility to rodent penetration • Oldest currently existing building built in 1921
Food Facilities • Areas where the campus community consumes food outdoors • 53 locations
Dining Areas 10 dining areas
Rodent Harborage: Algerian Ivy • 11 ivy patches
Loading Docks 35 loading docks 15 are conducive to pests
Vending Machines 49 vending machines
Given all of that… • Where do you think the rodent complaints would be?
Yearly rodent incident reports: 2008-2013
Bait Stations 269 bait stations
Solution: Suitability Model • A model that weights locations relative to each other based on given criteria • Suitability models might aid in finding a favorable location for a new facility, road, or habitat for a species of bird • Basically, suitability models “put it all together”
Suitability Model: How we weighted our factors • Rodent Report Locations: 30% • Trash Cans: 20% • Building Age: 10% • Food (facilities + dining areas): 10% • Ivy: 10% • Loading Docks: 10% • Vending Machines: 10%
Credits • Credit for project management and creating the GIS maps goes to Alan Chen, MPHand Airalee E. Rivera • Special thanks to Jennie Wung, REHS