Download
1 / 32
320 likes | 346 Views
A very dumb dummy thinks about modelling, contrasts, and basis functions. ?. What is the best way to model my experiment?. Model baseline? Specific questions? Prior Assumptions? Number of parameters?. Example. Finger tapping experiment 4 different forces used (parametric design)

E N D
A very dumb dummy thinks about modelling, contrasts, and basis functions. ?
What is the best way to model my experiment? • Model baseline? • Specific questions? • Prior Assumptions? • Number of parameters?
Example • Finger tapping experiment • 4 different forces used (parametric design) • interleaved with rest periods
What is the best way to model my experiment? • Model baseline? • more contrasts • It will be convolved • Issue of what a baseline is • Specific questions? • Prior Assumptions? • Number of parameters?
What is the best way to model my experiment? • Model baseline? • Specific questions? • Parametric increase • Mean effect • Difference between specific levels of factor (force) • Prior Assumptions? • Number of parameters?
What is the best way to model my experiment? • Model baseline? • Specific questions? • Prior Assumptions? • Linear / log increase? • Number of parameters?
What is the best way to model my experiment? • Model baseline? • Specific questions? • Prior Assumptions? • Number of parameters? • Too many to model individually? (DOF at 1st level) • Issues at the 2nd level
Possibilities for this example • Nonparametric • Main effects / contrast • Linear parametric • Mean correction of linear parametric • Quadratic parametric
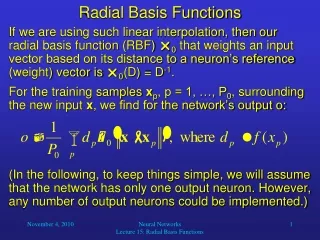
Non Parametric design Time (scans) Regressors 1 2 3 4 5
Non Parametric design Time (scans) Possible Contrasts 1 1 1 1 0 main effect of pressing -1 1 0 0 0 0 -1 1 0 0 0 0 -1 1 0 0 0 0 -1 1 0 1 0 0 0 0 0 1 0 0 0 0 0 1 0 1 2 3 4 0 linear increase 1 2 9 16 0 log increase Regressors 1 2 3 4 5
What if you have too many conditions? • Imagine one hundred force levels instead of 4. • Remember a degree of freedom is lost for every condition modelled … • There may also be limits on the number of contrasts which can be taken to the second level
Linear Parametric design Regressors: 1: 2: 3: LINEAR PARAMETRIC ALL PRESS MEAN
Mean Corrected Linear Parametric design Regressors NEW REGRESSORS 1: 2: 3: 0 0 MEAN CORRECTED
Quadratic Parametric design • Linear • Log • All press • mean Regressors
Summary: What is the best way to model my experiment? • Model baseline? • more contrasts • It will be convolved • Issue of what a baseline is • Specific questions? • Parametric increase • Mean effect • Difference between specific levels of factor (force) • Prior Assumptions? • Linear / log increase? • Number of parameters? • Too many to model individually? (lose DOF) • Issues at the 2nd level
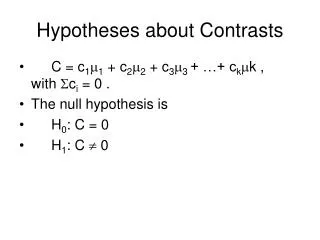
Which statistical test should I use? • T-test – tests specific one-way hypothesis • F-test – test more generally for related activity
contrast ofestimatedparameters c’b T = T = varianceestimate s2c’(X’X)+c T test - one dimensional contrasts - SPM{t } Tests one very specific hypothesis. User must specify whether looking for an increase or a decrease.
T test - one dimensional contrasts - SPM{t } • Linear • Log • Press • Mean Regressors Contrasts 1 0 0 0 - T1 0 1 0 0 - T2 0 0 1 0 - T3 0 0 0 1 - T4 -1 0 0 0 - T5 0 -1 0 0 - T6 0 0 -1 0 - T7 0 0 0 -1 - T8 8 T-tests required to test for all possible activities in this design matrix!!
additionalvarianceaccounted forby tested effects F = errorvarianceestimate F-test (SPM{F }) Tests multiple linear hypotheses: checks whether the tested effects explain significant variance within the data.
F test - one dimensional contrasts - SPM{f } • Linear • Log • Press • Mean Regressors Contrasts 1 0 0 0 - T1 0 1 0 0 - T2 0 0 1 0 - T3 0 0 0 1 - T4 -1 0 0 0 - T5 0 -1 0 0 - T6 0 0 -1 0 - T7 0 0 0 -1 - T8 A single F-test will tell you if any of these Contrasts would contain significant activity.
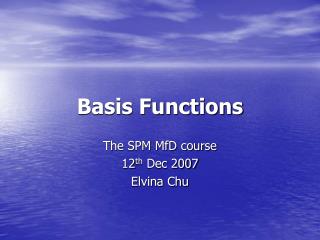
Switching gears… basis functions • Once we have the design, how do we relate it to our data?
Switching gears… basis functions • Once we have the design, how do we relate it to our data? • Time series of haemodynamic responses
Switching gears… basis functions • Once we have the design, how do we relate it to our data? • Time series of haemodynamic responses • Fit these using some shape…
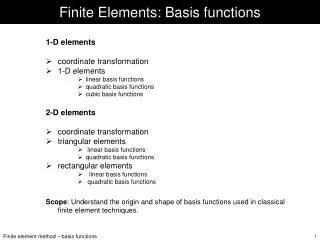
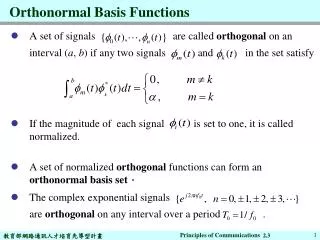
Basis functions • Can be used in combination to describe any point on a plane. • For instance, the (x, y) axes of a graph are basis functions which combine to describe points on the graph • The basis functions used in SPM are curves used to ‘describe’ or fit the haemodynamic response.
Summary • The same question can be modelled in multiple ways, but these are not always equally good, and there are many trade-offs. • T tests examine specific one-way questions • F tests can look significance within any of several questions (like an ANOVA) • Basis functions combine to describe the haemodynamic response