Download
1 / 43
430 likes | 456 Views
Learn how contrasts and basis functions work in statistical analysis, including modeling hypotheses, practical examples, and parametric vs. non-parametric approaches. Explore linear and non-linear regressors for effective data modeling.

E N D
Contrasts and Basis Functions Hugo Spiers Adam Liston
Overview • Contrasts - Hugo • What are they for? • What do I need for a contrast? • What types of model can I use? • What is the best model to use? • Basis Functions – Adam
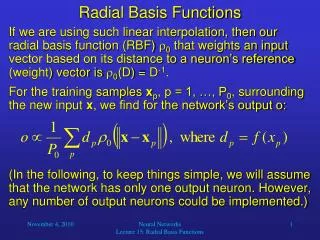
What is a contrast used for? • The GLM characterises postulated relationships between our experimental manipulations and the data • Contrasts allow us to statistically test a set of possible hypothesis about this modelled data
What do I need for a contrast? • Some data (Y) • A design matrix (X) • Parameters estimated with GLM (ß) • A set of specific hypothesis about the data
Simple Example Human Brain Function 2: Chapter 8 • Investigation of motor cortex • Subject presses a device then rests 4 times • Increasing the amount of force exerted with each press
Constructing the model • How do we model the “press” condition? • Hypothesis: We will see a linear increase in activation in motor cortex as the force increases • Model this with a regressor with a value for each time point a press occurs • These values increase linearly with each press • Since the signal is not on average zero (even without stimuli or task) a constant offset needs to be included
Constructing the model • Do we model the rest periods? • The information contained in the data corresponds effectively to the difference between conditions and the rest period • Therefore in this case NO
Non-parametric Model Time (scans) Regressors 1 2 3 4 5
Non-parametric Model A contrast = A linear combination parameters: C’ x ß Example c’ = 1 1 1 1 0 Time (scans) Regressors 1 2 3 4 5
Statistical Tests • T-test • Tells you whether there is a significant increase or decrease in the contrast specified • F-test • Tells you whether there is a significant difference between the conditions in the contrast
Non-parametric Model Example c’ = 1 0 0 0 0 Time (scans) Regressors 1 2 3 4 5
Non-parametric Model Example c’ = -1 1 0 0 0 Time (scans) Regressors 1 2 3 4 5
contrast ofestimatedparameters c’b T = T = varianceestimate s2c’(X’X)+c T-tests in Contrasts • A one dimensional contrast So, for a contrast in our model of 1 0 0 0 0: T = (ß1x1 + ß2x0 + ß3x 0 + ß4x0 + ß5x0) Estimated variance
Non-parametric Model Search for a linear increase Example c’ = 1 2 3 4 0 Time (scans) Regressors 1 2 3 4 5
Non-parametric Model Better to 0 centre the contrast Example c’ = -3 -1 1 3 0 Time (scans) Regressors 1 2 3 4 5
additionalvarianceaccounted forby tested effects F = errorvarianceestimate F-test • To test a hypothesis about general effects, independent of the direction of the contrast
Non-parametric Model Example Ftest c’ = 1 0 0 0 0 0 1 0 0 0 0 0 1 0 0 0 0 0 1 0 Time (scans) Regressors 1 2 3 4 5
Parametric Models • If you have too many regressors you reduce your degrees of freedom and your chance of finding false positives rises • Solution: Include regressors that explicitly takes into account prior hypotheses
Linear Parametric Model Time Time LINEAR PARAMETRIC ALL PRESS MEAN
Linear Parametric Model Regressors NEW REGRESSORS 1: 2: 3: 0 0 Main effect of pressing Removed
Non-linear models • Linear • Log • All press • mean Regressors
T-test Contrasts with our model Contrasts Regressors • Linear • Log • Press • 4. Mean 1 0 0 0 - T1 0 1 0 0 - T2 0 0 1 0 - T3 0 0 0 1 - T4 -1 0 0 0 - T5 0 -1 0 0 - T6 0 0 -1 0 - T7 0 0 0 -1 - T8
F- contrast with this model 1 specified Contrast Regressors • 1 2 3 4 (regressor) • 1 0 0 0 • 0 1 0 0 • 0 0 1 0 • 0 0 0 1 • Linear • Log • Press • 4. Mean
Summary • Contrasts are statistical (F or T) tests of specific hypotheses • Non-modelled information is taken into account implicitly in contrasts • F-Contrasts look for the effects of a group of regressors • T-contrasts look for increases or decreases • Non-parametric models can give fine grained information about the variables in the contrast • But, parametric regressors help reduce the number of regressors and test specific hypotheses directly • Parametric increases should be zero centred to specifically test for their effect rather than general increases or decreases relative to the baseline • Using linear and non-linear regressors can help to model parametric data more effectively
Switching gears… basis functions • Once we have the design, how do we relate it to our data?
Switching gears… basis functions • Once we have the design, how do we relate it to our data? • Time series of haemodynamic responses
Switching gears… basis functions • Once we have the design, how do we relate it to our data? • Time series of haemodynamic responses • Fit these using some shape…
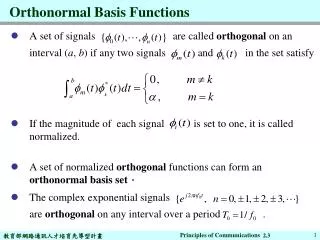
Basis functions • Can be used in combination to describe any point in space. • For instance, the (x, y, z) axes of a graph are basis functions which combine to describe points on the graph • Orthogonality?? (x, y, z, ?)
Fourier Series • Any shape can be described by a sum of sines and cosines – violin string
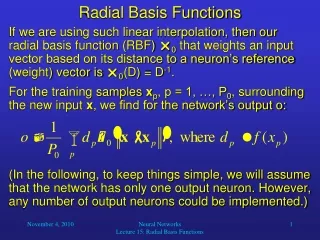
Temporal basis functions Basis functions used in SPM are curves used to ‘describe’ or fit the haemodynamic response. HRF+
Summary • The same question can be modelled in multiple ways, but these are not always equally good, and there are many trade-offs. • T tests examine specific one-way questions • F tests can look significance within any of several questions (like an ANOVA) • Basis functions combine to describe the haemodynamic response
spanner???! • For a “set” of basis functions, how do we use the T-test to test for an increase or a decrease?