Download
1 / 26
270 likes | 514 Views
OEAS 604 – Introduction to Physical Oceanography Eileen Hofmann John Klinck Chet Grosch. Two divisions of physical oceanography. Descriptive – description of the state of the ocean based on observations which are reduced to a summary or statement of the characteristic features of the ocean

E N D
OEAS 604 – Introduction to Physical Oceanography Eileen HofmannJohn KlinckChet Grosch
Two divisions of physical oceanography • Descriptive – description of the state of the ocean based on observations which are reduced to a summary or statement of the characteristic features of the ocean • Dynamical (theoretical) – apply laws of physics and use force balances and process to determine why and how the state of the ocean develops
Two divisions of physical oceanography • Descriptive – Use observations and numerical model output to provide quantitative descriptions of oceanic flow • Dynamical – Use theoretical studies and process-based numerical model experiments to understand what governs fluid flow in the ocean • Descriptive oceanography relies on understanding the processes that govern heat and salt content and distribution (density) in the ocean (thermodynamics)
Approach • Observations are used to determine what features need explanations • Laws of physics are used to derive equations that give balance of forces • Solve equations to learn how motions behave in space and time • Iterate between observations and theory to develop understanding and predictive capability
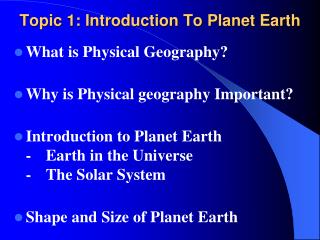
Historical Background • Most knowledge of physical oceanography derived from observations and theories from past 100 years • Knowledge of circulation goes back much longer • Descriptive physical oceanography goes back to 1700s – voyages of Captain Cook • Location of Gulf Stream known since late 1700s – Benjamin Franklin
Franklin-Folger map of the Gulf Stream. Source: From Richardson (1980, Science), Reprinted in Talley et al. (2011)
Background – Descriptive PO • First systematic treatment of physical oceanography was by Matthew Fontaine Maury in about 1850 • Developed charts of ocean circulation by combining available hydrographic data and observations • Late 1800s and early 1900s several major oceanographic expeditions – HMS Challenger (1872-1876), Meteor (1925-1927), HMS Discovery (1930s)
Background – Dynamical PO • The basis for much of theory in physical oceanography comes from Newton (1687) and Laplace (1775) • Major advances in theoretical development were made by Gustav Ekman (1905), Carl GustafRossbyand WilheimBjerknes(1930s) • Modern dynamical oceanography has origins in work by Harald Sverdrup and Henry Stommelin 1940s and 1950s • Development of large field programs in 1960s and 1970s provided observational basis needed to evaluate theoretical understanding
Course Focus • Average large-scale ocean circulation • Also consider coastal circulation, estuarine circulation, waves, tides, diffusive and turbulent processes • Include climate effects and interactions with atmospheric system • Consider a range of space and time scales
Time and space scales associated with physical oceanographic processes. From Talley et al. (2011)
Satellite-derived sea surface temperature from the Advanced Very High Resolution Radiometer (AVHRR) instrument. From Talley et al. (2011)
Circulation Background • Bathymetry of ocean basins is important to understanding of ocean circulation • Earth is about 70% water, 30% land • Most land is in the northern hemisphere – ratio of water to land is greatest in southern hemisphere • Major ocean basins are divided by land boundaries and separated by ridges within basins • Atlantic, Pacific, Indian, Arctic • Circumpolar ocean – Southern Ocean
Map of the world based on ship soundings and satellite altimeter derived gravity at 30 arc-second resolution. Data from Smith & Sandwell (1997); Becker et al. (2009); and SIO (2008), reprinted in Talley et al. (2011).
Sea floor age (millions of years). Black lines indicate tectonic plate boundaries. Source: Müller, Sdrolias, Gaina, and Roest (2008), reprinted in Talley et al. (2011)
Also see Table 1.4 in Knauss From Chapter 1 Sverdrup, Johnson, Fleming
Oceans Background • If include Southern Ocean with ocean north of it the total ocean area is: • Pacific Ocean – 46% • Atlantic Ocean – 23% • Indian ocean – 20% • Rest is about 11% • Smaller seas that are partially separated from ocean by land barriers – Gulf of Mexico, Mediterranean
Areas of Earth’s surface above and below sea level as a percentage of the total area of Earth (in 100 m intervals). Data from Becker et al. (2009), reprinted in Talley et al. (2011). See Table 1.4 in Knauss
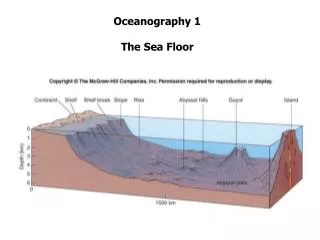
Bathymetry • Average depth is about 4000 m • Small relative to horizontal dimensions of ocean basins which are 5000 to 15,000 km • Vertical dimension is distorted relative to horizontal dimension • Other important features are • continental shelf – borders coast and extends seaward • shelf break/slope – important dynamically • Islands and seamounts
Schematic section through ocean floor Bathymetry measured along the South Pacific ship track From Talley et al. (2011)
Ocean Basins • Topography controls deep circulation • Ridges determine deep water pathways and exchanges between ocean basins • Sills control flow into ocean basins from marginal seas – Mediterranean, Norwegian Sea, Gulf of Mexico
Map of the Pacific Ocean. Etopo2 bathymetry data from NOAA NGDC (2008), reprinted in Talley et al. (2011)
Map of the Atlantic Ocean. Etopo2 bathymetry data from NOAA NGDC (2008), reprinted in Talley et al. (2011)
Map of the Indian Ocean. Etopo2 bathymetry data fromNOAA NGDC (2008), reprinted in Talley et al. (2011)
Map of the Arctic Ocean. Etopo2 bathymetry data fromNOAA NGDC (2008), reprinted in Talley et al. (2011)
Map of the Southern Ocean. Etopo2 bathymetry data fromNOAA NGDC (2008), reprinted in Talley et al. (2011)
Next Class • Properties of Seawater • Reading – Chapters 1, 2 Knaussand Chapter 3 Talley et al.