Dynamic, Rule-based Quality Control Framework for Real-time Sensor Data
Dynamic, Rule-based Quality Control Framework for Real-time Sensor Data. Wade Sheldon Georgia Coastal Ecosystems LTER University of Georgia. Introduction. Quality Control of high volume, real-time data from automated sensors is an emerging challenge

Dynamic, Rule-based Quality Control Framework for Real-time Sensor Data
E N D
Presentation Transcript
Dynamic, Rule-based Quality Control Framework for Real-time Sensor Data Wade Sheldon Georgia Coastal Ecosystems LTER University of Georgia
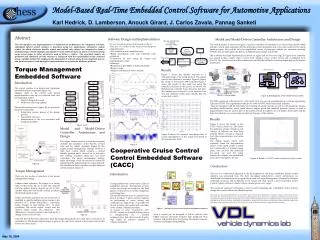
Introduction • Quality Control of high volume, real-time data from automated sensors is an emerging challenge • Traditional techniques (plotting, stats) often don’t scale well • Data validation and Q/C can be limiting factor in getting data “online” • Difficulties lead to release delays or posting provisional data • Software developed at Georgia Coastal Ecosystems LTER has proven useful for Q/C of real-time data • Designed to automate GCE data processing and metadata generation, but very generalized and supports any tabular data • Provides dynamic, rule-based Q/C framework for data processing, analysis and synthesis
Framework Components • Comprehensive data model • Implemented as hierarchical MATLAB ‘structure’ arrays • Package dataset & attribute metadata, data, Q/C rules, qualifier flags • Metadata-based MATLAB software (GCE Data Toolbox) • Automatic (rule-based) and manual assignment of Q/C qualifier flags • Transparent management of flags throughout all data manipulation • Q/C-aware data management and analysis tools • Q/C-aware data integration and synthesis tools • Modular implementation supports many scenarios • Interactive (command-line API and GUI forms) • Automated workflows (timed or triggered) • End-to-end (logger-to-scientist) or part of larger workflow • Runs natively on multiple platforms (PC, *nix, MacOS)
Quality Control Rules • Basic syntax: [logical expression]=’[flag code]’ • Logical Expressions: • Any conditional statement or call to MATLAB function that returns logical array (0 = false, 1 = true) • Dataset columns referenced in statements as: • “x” – alias for current column (e.g. x<0) • “col_[name]” – any dataset column by name (e.g. “col_Depth<0”) • Flag Codes: • Alphanumeric character to assign when expression true (I, q, 9, *) • Codes defined in the dataset metadata (I = invalid value, …) • Unlimited rules per attribute, multiple flags per value
Quality Control Rule Examples • Numeric Comparisons: • Simple: • x<0=‘I’ (flags negative values) • x<0=‘I’;x>100=‘I’;x<20=‘Q’;x>80=‘Q’ (overlapping bounds checks)
Quality Control Rule Examples • Numeric Comparisons: • Simple: • x<0=‘I’ (flags negative values) • x<0=‘I’;x>100=‘I’;x<20=‘Q’;x>80=‘Q’ (overlapping bounds checks) • Statistical: • x>(mean(x)+3*std(x))=‘Q’;x<(mean(x)-3*std(x))=‘Q’(flags values more than 3 standard deviations from column mean)
Quality Control Rule Examples • Numeric Comparisons: • Simple: • x<0=‘I’ (flags negative values) • x<0=‘I’;x>100=‘I’;x<20=‘Q’;x>80=‘Q’ (overlapping bounds checks) • Statistical: • x>(mean(x)+3*std(x))=‘Q’;x<(mean(x)-3*std(x))=‘Q’ (flags values more than 3 standard deviations from column mean) • Multi-column: • col_DOC>col_TOC=‘I’ (in column DOC; flags DOC exceeding TOC) • col_Dry_Weight<(col_Wet_Weight-col_Ash_Weight)*0.90 =’I’ (flags dry weights below 90% wet weight – ash weight) • col_Depth<0=‘I’ (in column Salinity; flags Salinity when Depth < 0)
Quality Control Rule Examples • Numeric Comparisons: • Simple: • x<0=‘I’ (flags negative values) • x<0=‘I’;x>100=‘I’;x<20=‘Q’;x>80=‘Q’ (overlapping bounds checks) • Statistical: • x>(mean(x)+3*std(x))=‘Q’;x<(mean(x)-3*std(x))=‘Q’ (flags values more than 3 standard deviations from column mean) • Multi-column: • col_DOC>col_TOC=‘I’ (in column DOC; flags DOC exceeding TOC) • col_Dry_Weight<(col_Wet_Weight-col_Ash_Weight)*0.90 =’I’ (flags dry weights below 90% wet weight – ash weight) • col_Depth<0=‘I’ (in column Salinity; flags Salinity when Depth < 0) • Compound (Boolean operators): • col_RH_Percent>100&col_Precip<=0.1=‘Q’ (flags humidity > 100% except during significant precipitation events)
Quality Control Rule Examples (cont.) • Text Comparisons: • “IS”, “NOT” for string literals, “IN”, “NOT IN” for lists • flag_notinlist(x,’Spartina,Juncus,Zizaniopsis’)=‘Q’
Quality Control Rule Examples (cont.) • Text Comparisons: • “IS”, “NOT” for string literals, “IN”, “NOT IN” for lists • flag_notinlist(x,’Spartina,Juncus,Zizaniopsis’)=‘Q’ • Algorithmic Criteria (custom functions): • fn(columns,parameters)=‘Q’ • Various included Q/C functions • pattern checks, geographic checks, specialized algorithms (O2 saturation, etc) • User-defined functions: • Any MATLAB code or “wrapped” calls to FORTRAN, Java, Python, etc • Unlimited scope
Quality Control Rule Examples (cont.) • Text Comparisons: • “IS”, “NOT” for strings, “IN”, “NOT IN” for lists • flag_notinlist(x,’Spartina,Juncus,Zizaniopsis’)=‘Q’ • Algorithmic Criteria (custom functions): • fn(parameters)=‘Q’ • Various included Q/C functions • pattern checks, geographic checks, specialized algorithms (O2 saturation, etc) • User-defined functions: • Any MATLAB code or “wrapped” calls to FORTRAN, Java, Python, etc • Unlimited scope • Full suite of MATLAB numeric analysis capabilities supported, and extensible to use other technology
Q/C Rule Management • Rule definitions can be defined in metadata “templates”, automatically applied to attributes when raw data imported • Rules can also be created, managed using a GUI form
Q/C Flag Assignment • Q/C criteria evaluated to assign/clear flags when: • Metadata template applied or Q/C criteria edited • New data records, columns added • Values edited (GUI) or columns updated (CLI) • Evaluation function (dataflag) invoked directly • Flags can also be assigned/cleared manually by: • Clicking/dragging on plots with the mouse • Using a spreadsheet-like grid • Importing from text attributes (e.g. 3rd party codes) • Propagating flags from source column(s) to dependent column(s) • Manual assignment locks flags by inserting “manual” token in criteria, removing “manual” restores automatic evaluation
Q/C-Aware Data Management & Analysis • Q/C flags can be visualized in data editor grid and plots • Flagged values can be selectively removed from data sets • Statistics can be generated with/without flagged values • Flags can be instantiated as coded text columns for export • Flagged, missing values can be summarized by parameter and date for metadata
Q/C-Aware Data Synthesis • Flagged, missing values summarized in re-sampled data (aggregated, binned, date-time resampled), with automatic Q/C rule creation • Flags automatically “locked” when merging multiple data sets (i.e. unions) • All Q/C operations logged to processing history, reported in metadata to document lineage
Implementation Scenarios • End-to-End (logger-to-scientist) • Acquire raw data from logger or file system (standard or custom import filters) • Assign metadata from template or using forms to validate and flag data • Review data and fine-tune flag assignments • Generate distribution files & plots, archive data, index for searching • Desktop data management solution • Data Pre-processing • Acquire, validate and flag raw data (on demand or timed/triggered) • Upload processed data files (e.g. csv) or value & flag arrays to RDBMS • Workflow Step • Call toolbox functions as part of another workflow process, custom program • Kepler MATLAB actor?
Suitability for Real-Time Sensor Data • Good Scalability • Data volumes only limited by computer memory (tested >2 GB data sets) • Multiple instances can be run on high-end, 64bit, clustered workstations • Good flag evaluation performance in use, testing with diverse rule sets • Good scope for automation • Timed and triggered workflow implementations easy to deploy • Support for multiple I/O formats, transport protocols • Formats: ASCII, MATLAB, SQL, XML (partially implemented) • Transport: local file system, UNC paths, HTTP, FTP, SOAP • Already used for real-time GCE data, USGS data harvesting service (LTER HydroDB, CWT)
Concluding Remarks • Benefits • Flexible, modular design • No qualifier vocabulary, semantics assumed – many purposes, standards • Many operations on flagged values – supports different strategies for archiving and distributing data at different processing levels • Limitations • Requires MATLAB • Rule syntax environment-specific – a more open standard would be ideal • Support for XML metadata immature (but more development planned) • More information and downloads at:http://gce-lter.marsci.uga.edu/public/im/tools/data_toolbox.htm This work was supported by the National Science Foundation under grant numbers OCE-9982133 and OCE-0620959