Download
1 / 13
130 likes | 282 Views
Instrument guide Fluxes: CSAT CSAT + Li7500 CSAT + KH20. Update 17/06/2011 Simone Kotthaus Previous version: 11/07/2010 15/12/2010. General Information. Raw data on I –drive, all other on dataBridge01 (A drive on Otago ) Intermediate results and plots are stored on A:/works

E N D
Instrument guide Fluxes:CSAT CSAT + Li7500 CSAT + KH20 Update 17/06/2011 Simone Kotthaus Previous version: 11/07/2010 15/12/2010
General Information • Raw data on I –drive, all other on dataBridge01 (A drive on Otago) • Intermediate results and plots are stored on A:/works • Final results and formatted raw data are stored on A:/data • File formats of txt files (raw data) can be found in A:/data/META/London/KUMA_logbook.xls • (Internal information: File formats of netcdf according to /META/file.csv) • The task is scheduled on Data02 to run at 1:30 am: 30 1 * * * cd /home/micromet/Roofprograms/ECFluxes/; ./FLUX_V5.sh • For troubleshooting, see below • If changes to the instrument setting are made, update location and calibration file, for details see below
OTAGO ROOF8 KSK Mast CSAT3 u, v, w, Ts LoggerNet KSK Mast 10_09_10.CR5 C:\CR5000\Fast\CR5000_Fast.dat HourlySplitKSK [hh:18] D:\Cr5000_outdata\KSK\fastHourly\KSKFast_YYDOY_HH.txt HourlySplit[hh:28] D:\Cr5000_outdata\KSS\fastHourly\KSSFast_YYDOY_HH.txt CR5000 Data Logger wires KH20 H2O • GAS-LAS-WXT-Ceil [hh:15] • grabs CSAT hourly data to I:\Data\YYYY\London • \KSK\CSAT_Hrly\MM\KSKFastYYDOY_HH.txt • \KSS\CSAT_Hrly\MM\KSSFastYYDOY_HH.txt ROOF13 KSS Tower CSAT3 u, v, w, Ts LoggerNet KSS tower 01_09_10.CR5 C:\CR5000\CR5000_Fast.dat which is on Otago linked to T:\CR5000\CR5000_Fast.dat CR5000 Data Logger • The Otage drive I:\Data is mounted to Data02 under /media/London-I • Output server databridge01 is mounted to Data02 under /media/micromet wires Li7500 H2O, CO2 Data02 cronjob: FLUX_V5.sh [daily task: 01:30] Processing for KSK and KSS using Ecpack $OUT= /media/micromet/data/$yyyy/London/$level/$site/DAY $WORK=/media/micromet/works/$yyyy/London/ 1) LondonFlux_V11.R Calculate 30min averages to $OUT/$name_$site_$YY$DOY_30min.nc write input files for ECpack to $WORK/Ecpack/$MM Plot 30 min averages to $WORK/Level_1/ECFluxes/plots/$MM • 2) runECpack_V9.sh • London specific info and data files required • KSK and KSS for L0 , L1, L2 input, averaging interval = 30 min • output to $WORK/Level_?/ECFluxes/Ecpack/$site/$MM/Fluxout_$site_$YY$DOY.txt • 3) LondonFluxOut_V9.R • Final quality control, plot results, store netcdf on databridge: $OUT/CSAT_Ecpack_$name_$site_$YY$DOY_30min.nc • Plot results to $WORK/Level_1/ECFluxes/plots/$MM/.$plotname.png
KH20 (red) Ground for CSAT (clear/black) Power for CSAT (red) Power for KH20 (red) KSK mast 2 CSAT (white) KH20 (white/clear) CSAT (brown) CSAT (green) KH20 (black) KH20 (green) 2 1 1 H L G G SDM-C1 SDM-C2 SDM-C3 12 V 20 BUT currently: No gas analyser in operation! back 1) Sonic anemometer: CSAT3 2) Infrared gas analyser: KH20 Ground KH20 (black) wire extension
Ground for CSAT (blue) Power for CSAT (red) CSAT3 back KSS tower CSAT (white) LI-7500 (yellow) LI-7500 (green) LI-7500 (red) CSAT (brown) CSAT (green) WXT510 LiCor7500 CNR1 G G 12 V 12 V SDM-C3 SDM-C1 SDM-C2 Sky sensors (signal conversion) (brown) (blue) (grey) Cable extension for LICOR Separate power supply for LI-7500, connected to Logger power supply CSAT (black) LI-7500 (blue) (black) (red) - +
LoggerNet settings back
back Linux Scheduled Task = cronjob Crontab = list of current cronjobs To display current crontab, type ‘crontab -l’ which should result in: SHELL=/bin/bash PATH=/etc:/bin:/sbin:/usr/bin:/usr/sbin:/usr/local/sbin:/usr/local/bin HOME=/home/simon 25 2 * * * /home/simon/Roof/ECFluxes/FLUX_V9.sh 1 5 * * * /home/simon/Roof/ECFluxes/append_DiagSummary.sh To make changes, edit crontab with ‘crontab -e’. every day of week location/name of cronjob every month every day hour of the day minute past the hour
runEcpack.sh needs the following input: Working directories: A:/works/yyyy/London/Level_1/ECFluxes/Ecpack/site/MM/ A:/works/yyyy/London/Level_2/ECFluxes/Ecpack/site/MM/ A:/works/yyyy/London/Level_3/ECFluxes/Ecpack/site/MM/ • Daily data files: siteCSAT_yyDOY.nc • Calibration files CSAT_London_site_yyDOY.qq, H2O_London_site_yyDOY.qq • Time and reference data information: ectimes_30_yyDOY.txt • Planar fit boundaries planint_yyDOY.dat Control files are stored under /home/simon/ECFluxes/Ecpack • ecconf_London_CSAT or ecconf_London_CSAT_Li7500 or ecconf_London_CSAT_KH20 is used according to instrument setting, these files also specify which sec_London.dat is needed
Coordinate System • Planar Fit Method (Wilczak et al. 2001) Planar least squares fit applied to collection of run mean horizontal & vertical velocities to find b-constants. • Use boundaries of min. 24h to include different wind directions • Assumption of stationary instrument position • Double Coordinate Rotation (Kaimal and Finnigan 1994) • Yaw-correction: fix z-axes • Pitch-correction: fix y-axes • Strong winds can result in unreasonable tilt angles, hence not advisable • Perform after PF: • standard reference frame for sonic measurements
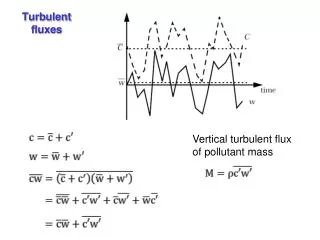
Correction of sonic temperature for humidity (Schotanus et al. 1983) • Speed of sound depends temperature and humidity • Correct covariance WPL-correction (Webb et al. 1980) • Fluctuations in air density contribute to non-zero vertical velocities • Ad Webb-term for turbulent fluxes Correction for frequency losses (Moore 1986, Horst 1999) • limited frequency response of sensors • averaging over path rather than taking a point value • separation between sensors for different quantities • compare measured spectra with theoretical spectra
Example - EC_orientation.csv Settings: sensor positions • zs = sensor height, zd = displacement height, zp = z’ = zs – zd • begin, end = YYYYDOY • csatSN = CSAT3 serial number, irgaSN = serial number of gas analyser • irgaType = type of infrared gas analyser, 0=none, 1=Li7500, 2=KH20
N degCSAT= degree CSAT head towards N degIRGA= degree KH20 or Li7500 towards N drcnIRGA= direction from CSAT3 towards IRGA = sitting in CSAT volume looking towards IRGA volume as degree from north sep = separation from CSAT volume to IRGA volume in cm sepX= separation from CSAT volume to IRGA volume, x component – referring to CSAT3 right hand side coordinate system sepY= separation from CSAT volume to IRGA volume, y component
Troubleshoot back The most common failure is caused by an interference between hourly split and WXT-programme: • An hourly file is a) not or b) just partly (first 6 minutes) transferred from D:\CR3000_outdata\ to I:\Data\London\$site\YYYY\CSAT_Hrly\MM\ Procedure: • Compare data availability in both directories • a) Copy file from D:\... To I:\... b) open hourly file in both directories and append data from D:\... to the file in I:\... • Login on Data02via putty • Go to script path “cd /home/micromet/Roofprograms/ECFluxes/” • Rerun the scheduled task “./FLUX_V9.sh” If you want to rerun the process for a day other that yesterday, run “./FLUX_V9_rerun.sh N” With N = number of days before today (e.g. Day before yesterday would be N=2)