Download
1 / 21
210 likes | 362 Views
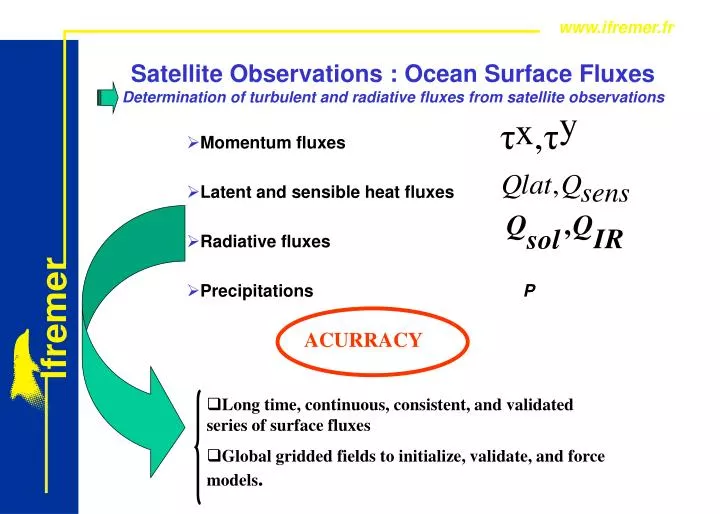
Satellite Observations : Ocean Surface Fluxes Determination of turbulent and radiative fluxes from satellite observations. Momentum fluxes Latent and sensible heat fluxes Radiative fluxes Precipitations P. ACURRACY.

E N D
Satellite Observations : Ocean Surface FluxesDetermination of turbulent and radiative fluxes from satellite observations Momentum fluxes Latent and sensible heat fluxes Radiative fluxes Precipitations P ACURRACY • Long time, continuous, consistent, and validated series of surface fluxes • Global gridded fields to initialize, validate, and force models.
Surface winds and latent heat flux patterns at global and local scales. • IFREMER : A. Bentamy; L. H. Ayina; P. Queffeulou; J. F. Piollé • AOML/NOAA : K. Katsaros; A. M. Nuñez • Météo-France : P. Leborgne; H. Rocquet • U. Miami : W. Drennen • U. Maryland : R. Pinker
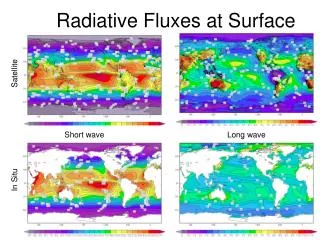
Radiative Fluxes (Leborgne et al, 2001) Daily Estimates : 16 Sep. 2002
Sea Surface Temperature MedspirationEuropean Node (GHRSST-PP) • Data processing system, an off-line data archive anddata productdissemination service. • European RDAC service to the GHRSST-PP and provide SST dataproducts tospecific operational European users in near real time. • Use complementarysatellite L2 SST and in situ data products together to deliver a new generation of SST data products ( 2-10km; 6 hours). • Satellite data input • AATSR• AVHRR• TMI• AMSREAMSR• MSG• SSM/I • ftp.ifremer.fr/pub/ifremer/cersat/SAFOSI/Products/NARSST
Annual Mean of Wind Stress and Latent Heat Flux from Satellite, ECMWF, and ERA40 The main issue is how to estimate the quality of such satellite retrieved parameters and especially how they compare to the parameters calculated by numerical models like ECMWF and NCEP?
Turbulent Fluxes from Satellite Measurements Objective • Calculation and validation of independent momentum and latent and sensible heat fluxes derived only from satellite data. Questions • How numerical model analysis data compare to satellite wind and latent heat flux estimates? • How explain the differences? • What is the effect of new version of satellite algorithms and of numerical models? • What is their impact as aforcing function for a numerical oceanic model ? • How satellite and model flux patterns (distributions, interannual and seasonal variability …) compare over an oceanic basin? Specific Issues • Accuracy of remotely sensed flux estimates : 1991 - 2004 • Comparisons to the atmospheric analysis and re-analysis products • Global and local error analysis • Surface flux time series • Surface flux patterns
Data for Validation / Calibration • Buoy Networks • 1/2 : NDBC • 3 : Europe (ODAS) • 4/5 : TAO / PIRATA • In-Situ • COADS • Experiments (Fastex; KNORR; EPIC; PACS N/S; FETCH; POMME; EQUALANTE) • Multi-Satellite • Numerical Models • ECMWF analysis/re-analysis (ERA40) • NCEP re-analysis
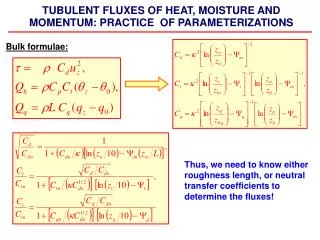
Accuracy of the remotely sensed turbulent fluxes • Calibration / Validation • Inverse and Direct models (algorithms) • Parameters : Wind conditions, Sea State, Curent, Rain, Stability; … (U,)=f(°); (x,y)=f(U ,) (Bentamy et al, 2002; Bentamy et al, 2004; Sotillo et al, 2004; Blank et al, 2004) E = CE(U-U0)(qs-qa) Ta = f(qa,U,SST) Shf = CpCH(U-U0)(SST-Ta) qa= F(Tb, SST) (Bentamy et al, 2003; Curry et al, 2004; Katsaros et al, 2004; Mestas et al, 2004; Ayina et al, 2004; Raoult et al, 2004)
Accuracy of the remotely sensed turbulent fluxes Accuracy of backscatter model Accuracy of Specific Air Humidity
Accuracy of Remotely Sensed Wind Speeds and directions1992 – 2003
Comparison Buoy /ECMWF / Satellite Winds Atlantic Ocean : 30°N – 55°N ERS-1 ERS-2 ECMWF
Comparison Buoy /ECMWF / Satellite Winds Atlantic Ocean : 30°N – 55°N ERS-1 ERS-2 ECMWF
Comparison Buoy /ECMWF / Satellite Winds Tropical Ocean : 10°S – 10°N ERS-1 ERS-2 ECMWF
Accuracy of the Satellite Flux Analysis Time Series of Latent Heat Flux at three Pirata buoylocations Buoy / Satellite Correlations Buoy Satellite ERA40 ECMWF
Impact of flux in numerical simulatons (Ayina et al. 2004a et b) • Numerical model : ORCA (Madec et al, 1998) • Period : 1996 - 1998 Three simulations EXP1 Forcing experiment using daily ECMWF fluxes (EXP1). SST et SSS are derived from RS94 et Levitus (1998).. EXP2 Similar to EXP1, except that LHF are satellite estimates. EXP3 Similar to EXP1 execp that LHF and wind stress are satellite estimates.
Impact of flux in numerical simulatons FIG1. Three years mean zonal (a) and meridian (b) stress wind from ECMWF analysis (black line) and ERS1/2 (red line). The net heat flux (c): black line is what all components are from the ECWMF analysis (black line) and red line is in which the latent heat flux or evaporation is deducted from satellite measurements. The different of their SST with Reynolds and Smith (1994) (f) : black (EXP1), bleu (EXP2) and red (EXP3) line.
Impact of flux in numerical simulatons FIG2. Three years mean vertical structure temperature at 2°N- 156°E (a), at 2°S-156°E (b), at 2°N-110°W (c) and 2°S-110°W (d). The mean square of temperature at 2°N -110°W (e) and at 2°S-110°W (f). Black-dotted line – TAO, Black solid line EXP1, Bleu line EXP2 and red line EXP3.