Download
1 / 24
240 likes | 330 Views
Analyzing the relationship between crime rates and property market capitalization, this presentation delves into the economic impact of public safety on real estate. By assessing the value of statistical life and the effects of different types of crimes, the research sheds light on how crime influences property prices at both city-wide and neighborhood levels. Through a comprehensive literature review and detailed model specifications, the study provides valuable insights into the role of public safety in real estate economics. The results highlight the varying effects of crime reduction on different income strata and the significance of factors such as educational quality and proximity to public parks in property valuation. Ultimately, the findings emphasize the positive economic impact of deterring crime for both individuals and communities.

E N D
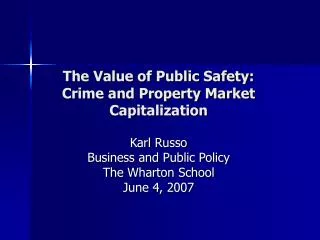
The Value of Public Safety: Crime and Property Market Capitalization Karl Russo Business and Public Policy The Wharton School June 4, 2007
Outline of Presentation • Motivation • Literature Review • Model Specification • Data • Results • Conclusion
Motivation • Need marginal benefits to allocate resources efficiently • Property market captures welfare benefits if wages fixed Rosen/Roback • To what extent does crime affect house prices? • Does crime next door matter? • Do effects vary by type of crime?
Preview of Results • Value of statistical life $7.8M - $8.6M • Eliminating one crime raises property values city wide by $51,350 or $2575 annually • Violent crimes have and estimated impact 3.5 times that of property crimes ($5922 vs. $1636 per year) • Neighboring crime rates have an estimated elasticity four-five times that of own crime rates • Effects vary by income
Literature Review • Rosen 1979 and Roback 1982 compensating differentials • Thaler 1978 elasticity -0.07, cross-sectional, transaction prices (n=398), rejected using neighboring crime rates • Hellman and Naroff 1979 elasticity of -0.63, self-reported census value, limited controls, extend to property tax effect • Lynch and Rasmussen 2001 transaction prices, n=2880, weight by seriousness of crime to obtain “cost of crime”, little overall effect, high crime areas highly discounted • Schwartz et al. 2003 transaction prices, n=246,743, precinct level crime data, violent crime elasticity -0.13, property -0.01 • Linden and Rockoff 2004 Megan’s Law 4% drop for homes in 0.1 mile radius of sex offender • Gibbons 2004 1/10 standard deviation increase in criminal damage decreases property values just under 1% L110/household/year
Housing Model • Rosen/Roback • max U(x, h; G) subject to w = x + h*p(S, L, N) • Long-run equlibrium equalizes utility across locations • Variation in house values V = v(S, L, N, w, G) compensates for variation in amenities across locations
Specification • ln valueijt = β0 + Sijtβ1 + Lijβ2 + ln crimejtβ3 + Gjtβ4 + εj + εt + εijt • Public Goods, G • Murder rate • Crime rate • Neighboring crime rate • Temporally lagged crime rate • Educational Quality • Average Tax Rate • Enterprise Zone • Proximity to public parks
Crime Model • Return from honest work: r = w + φ • Return from crime: v(mi,ni) = (1 – p(mi,ni)) z(ni) – p(mi,ni)*F • Crime is decreasing in w, φ, m, and F and increasing in z • Impact of n is ambiguous criminals • positive externalities via arrest probability • negative externalities via competition
income v* r1 v0 r0 n2 n1 n0 thieves Crime Model
Data Sources • Cartographic Modeling Lab/GIS Lab • Philadelphia Police Department • Pennsylvania Department of Education • Board of Revision of Taxes • Penn Real Estate Department • Census Bureau
Data: CML/GIS/PPD/PDE • violent crimes: robbery, aggravated assault • property crimes: burglary, theft, auto theft • Annually 1998-2003 • Population data • Create crime rates for each block group • Construct neighboring crime rates using GIS • Precinct level murder rate-averaged over previous three years • Fifth grade PSSA score
Data: BRT/RED • All arm-length single-family sales 1/2000-6/2004 • Transaction price, parcel identifier • Property tax rate- averaged over block-group-year • Structural: lot sqft, lot sqft sq, bldg sqft, bldg sqft sq, FAR(tract), # stories, type of structure, exterior material, exterior condition, fireplaces, multifamily, garage, central air, amenities (e.g. pool), improvements • Locational: distance to CBD, dist sq, mixed use, irregular, above street, view, corner, adjacent to vacant lot, borders park, ¼ mile from park, enterprise zone • Neighborhood dummies: block group
Results: Crime • Value of statistical life $7.8M - $8.6M (EPA $6.94 Million) • Eliminating one crime raises property values city wide by $51,350 or $2575 annually • Violent crimes have and estimated impact 3.5 times that of property crimes ($5922 vs. $1636 per year)
Results: Public Goods • Low income neighborhoods do not appear to value crime reduction- possible lack of alternatives • Middle class neighborhoods have the highest valuations on safety $8450 for violent and $1900 for property crimes • High income areas have strong aversion to own violent crime, neighborhood effects are insignificant- insulating effect
Results: Public Goods • 64% property tax capitalization • Education elasticity 0.38 • Proximity to public parks valued only in low income areas, at approximately $240 per year or 2% of income • NTI impact on low income and property tax abatement impact on high income consistent with pattern observed here
Conclusion • Deterring crime has a significant positive economic impact on the city’s housing values and property tax base • Failure to account for geographic spillovers would lead to a substantial underestimate of the total effect • Violent crimes have a greater impact on housing values than property crimes • Effects vary by neighborhood income
Conclusion • Police department should spend resources up to the point where annual marginal cost of crime reduction is less than $5922 per violent crime or $1636 per property crime • Aggregate calculations suggest • Direct impact of crime $227 Million over 5 years • Impact neighboring crime $1 Billion • Marginal Justice Spending ~$900M