1 / 1

Greenhouse Temperature Comparison during Inoculation Testing (2010 vs. 2011)

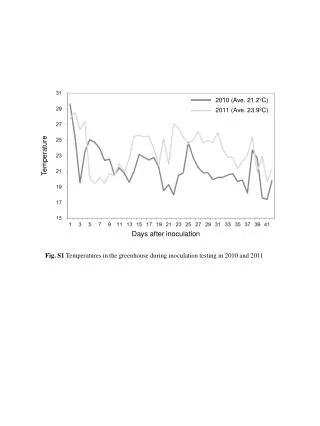
Comparison of greenhouse temperatures during inoculation testing in 2010 (average 21.2ºC) and 2011 (average 23.9ºC). Analyzing the variation in temperatures for better understanding.

maxim
Download Presentation

Greenhouse Temperature Comparison during Inoculation Testing (2010 vs. 2011)

An Image/Link below is provided (as is) to download presentation Download Policy: Content on the Website is provided to you AS IS for your information and personal use and may not be sold / licensed / shared on other websites without getting consent from its author. Content is provided to you AS IS for your information and personal use only. Download presentation by click this link. While downloading, if for some reason you are not able to download a presentation, the publisher may have deleted the file from their server. During download, if you can't get a presentation, the file might be deleted by the publisher.

E N D

Presentation Transcript


  1. Temperature 2010 (Ave. 21.2ºC) 2011 (Ave. 23.9ºC) Days after inoculation Fig. S1 Temperatures in the greenhouse during inoculation testing in 2010 and 2011

More Related