Download
1 / 23
240 likes | 397 Views
CALIBRATION OF THE VLF SIGNAL OF VTX 18.2 KHz STATION BY A RECEIVER IN MALDA. Asit Kumar Choudhury, ICSP (Malda Branch) Prof. Sandip Kumar Chakrabarti, SNBNCBS & ICSP, Mr. Suman Ray, ICSP, and

E N D
CALIBRATION OF THE VLF SIGNAL OF VTX 18.2 KHz STATION BY A RECEIVER IN MALDA Asit Kumar Choudhury, ICSP (Malda Branch) Prof. Sandip Kumar Chakrabarti, SNBNCBS & ICSP, Mr. Suman Ray, ICSP, and Mr. Sudipta Sasmal, ICSP,
It also has been reported that the time taken to form the D-region or to dissolve it through recombination also becomes anomalous immediately prior to the earthquake (Chakrabarti & Sasmal 2007 and Chatterjee, Bari & Choudhury 2009).
In order to establish a consensus in this issue, especially in the context of Indian scenario, Indian Centre for Space Physics (ICSP) has been recording the VLF signal for the last several years transmitted from the Indian Navy station VTX near the southern tip of India
At ICSP we are involved in preparing such Standardized Calibration Curves (SCCs) for a large number of baselines in order that the ionospheric anomalies may be pinpointed very accurately • SCC for VTX-ICSP (Kolkata) baseline has already been published (Chakrabarti et. al. Nat. Hazards…2009) by ICSP . • Here we present SCC for VTX-ICSP (Malda) baseline only.
Experimental SetupWe have used a Gyrator II loop antenna made on a square frame of one-meter side. Several turns of a shielded single core wire are wound over the frame. • DAQ card connected to a • computer for continuous data • acquisition • * Receiver (made at ICSP)
Transmitting StationReceiving Station VijayanarayanamMalda Latitude – 08°26´ North Latitude – 25° North Longitude - 77°44´ East Longitude - 88°08´ East
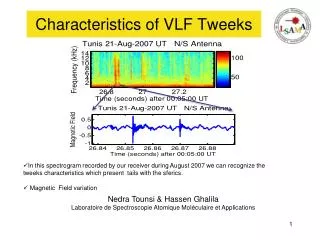
Some Classical data from VTX-station received at Malda centre. Time (IST=UT+5:30:00) The signal clearly showed recovery after the sunrise terminator and before the sunset terminator. The “cosine” pattern of the solar flux is clearly visible in the daytime.
Standardized Calibration Curves (SCCs) • In order to obtain the “mean” Sunrise terminators (SRT) and Sunset terminators (SST) over the year we now present four years of data (2005, 2007–2009). • We have not removed the data for those days in which the SRT or SST may be anomalous due to seismic activities, because we did not have any reference frame to quantify the disturbance. • However, once the mean SCCs are drawn for the sunrise and sunset, significant deviations from the mean may be used to judge whether there is any real correlation between the ionospheric and seismic activities
Calibration curve for Malda-data of 2005,07 Here we observed that generally SRTs and SSTs fall in between the curves of local sunrise - sunset times, and VTX sunrise - sunset time, though in some days there are exceptions.
We note that the SCC for sunrise is situated roughly midway between the SR Malda and SR VTX curves. This indicates that the terminators may dominated by a single hop and the signal is reflected from halfway between the transmitter and receiver. Standardized Calibration Curve Superpose all the four years’ data into a single plot to obtain the standardized calibration curve (SCC) for the VTX-Malda baseline. The coloured curves are our standardized calibration curve for the VTX-MALDA baseline, which we obtained by taking running mean of all the observed points.
Comparison of the original day length of Malda and VTX with VLF-day-length (SST-SRT) using the data of 2005,07,08. TD-MAL TD-VTX In the winter period the VLF day length is closer to TD (Malda ) in summer, it is somewhat intermediate between TD (Malda) and TD(VTX).
The correlation with seismic activities. • To see if correlation between the length of the “VLF day” and the seismic activities, we use the data for the period of January to December 2008. • First, we plot the day-length as a function of day
To obtain the mean variation during the period, we took the running mean of the all observed data • Then we calculate initially the standard deviation (σ) using the above mean plot and we remove the data which are away from σwhole . • Using rest of the data we again compute the standard deviation σ and plotted curves which are σ, 1.5σ, away from the mean.
In some days the anomalous deviations, as high as 2σ , some seismic activities were generally found in those or nearby days. Variation of the VLF-day-length
We associated such activities with those anomalous days and marked the association by larger circles. These circles are kept at a constant distance away from the observed points (squares), and thus, their exact co-ordinates are not important. Variation of the VLF-day-length
Co-relation between the deviation of VLF-day-length and the effective magnitude of earthquake • We compile the latitudes and longitudes of the epicentre, magnitude and depth of the earthquakes, its magnitude, from the Indian Meteorological Department • The actual magnitudes of the earthquakes are not important since we are interested in the energy deposition by these earthquakes near the mid-point of the great circle path instead of taking the original magnitude
we calculate the energy of these earthquakes from log10E=4.4+1.5Ms (for earthquake less than 5.0 magnitude) and log10E=5.24+1.44Ms (for earthquake greater than 5.0 magnitude) where, E=Energy of the earthquake in Jules, and Ms=surface wave magnitude (Lowrie, 2007)
In the days when more than one earthquake occurs, we calculate the total energy from the individual earthquakes. • From this, by reverse process, we find out the effective magnitude on each day. • We thus have the deviation of the VLF-daylength from the mean and the effective magnitude on any given day (effective magnitude is zero onnon-seismic days) which enable us to compute the correlation coefficients.
Co-relation between the deviation of VLF-day-length and the effective magnitude earthquake Figure shows the correlation of these two quantities. We observethat a weak correlation peaks at Three days ahead of the earthquake.
CONCLUSIONS 1) We obtained the SCCs for VTX-ICSP baseline 2) It appears that there are deviations of the VLF day length closed to the days on or nearby seismically active days 3) We found that the Correlation coefficient shows a weak peak three days prior to the seismic activities. In future we shall try to co-relate our results with the data received from other places which will help us to improve the predictability of earthquakes.