Download
1 / 3
Enhancing Genotype Profiling Accuracy Using Melt Calibration Signals
40 likes | 119 Views
Explore the improved genotype clustering through melt calibration signals in SMA test analysis. Witness the impact of calibration on profiling data clustering. Benefit from tighter genotype profile arrangements. Optimize your research outcomes today!
Download Presentation 
Enhancing Genotype Profiling Accuracy Using Melt Calibration Signals
An Image/Link below is provided (as is) to download presentation
Download Policy: Content on the Website is provided to you AS IS for your information and personal use and may not be sold / licensed / shared on other websites without getting consent from its author.
Content is provided to you AS IS for your information and personal use only.
Download presentation by click this link.
While downloading, if for some reason you are not able to download a presentation, the publisher may have deleted the file from their server.
During download, if you can't get a presentation, the file might be deleted by the publisher.
E N D
Presentation Transcript
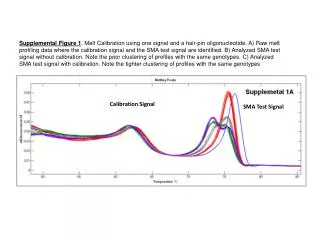
Supplemental Figure 1. Melt Calibration using one signal and a hair-pin oligonucleotide. A) Raw melt profiling data where the calibration signal and the SMA test signal are identified. B) Analyzed SMA test signal without calibration. Note the poor clustering of profiles with the same genotypes. C) Analyzed SMA test signal with calibration. Note the tighter clustering of profiles with the same genotypes Calibration Signal SMA Test Signal


More Related