Download

1 / 21
210 likes | 321 Views
DSAdvance Training Quick Reference. Contents. Main Areas of Advance Selecting Form of Output Finding Required Series Selecting an Economic Series Creating a Line Chart Creating a Comparison Chart Ranking Downloading Projects Local Lists Creating Local Lists Manually

E N D
DSAdvance Training Quick Reference
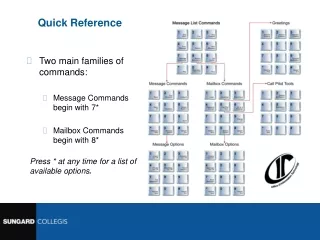
Contents • Main Areas of Advance • Selecting Form of Output • Finding Required Series • Selecting an Economic Series • Creating a Line Chart • Creating a Comparison Chart • Ranking • Downloading • Projects • Local Lists • Creating Local Lists Manually • Downloading Constituent Lists • Advance For Office • Downloading Through AFO • AFO Continued and Request Management • AFO Tables • Manipulating Data/ Functions • Manipulating Data/ Functions continued • DSWindows Request Equivalents
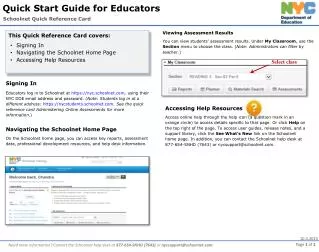
1. Main Areas of Advance Request Window These tabs select the type of output, e.g. Overview, Chart etc. Output window Run the request Start/End Dates Data type Series Selection Tabs Currency Selector Scroll button for more tabs Use this field to search for a series Starting up Advance will bring up the request window illustrated above. From this window you need to firstly select the series you’re interested in and then select the type of output and start date etc and then clicking the Run Now button to execute the request.
2. Selecting Form of Output The options which appear below the tabs above will depend on the type of series you have highlighted, although in principal the underlying option will be similar. is replaced by when the selected series tab is either ‘constituents’ or ‘local lists’. An Overview or Snapshot including a graph and text data of a selected series. You will be able to alter the start date A chart of an individual series. This would include line charts, price relatives and moving average charts etc. You will be able to alter the start and end dates and the data being displayed Text Reports for an individual series. This will include changes in value over time, company account reports etc. Download one piece of information to Excel The most useful tab when viewing lists both graphically and in text form. Can also download data using the ‘Static Data’ option within this selection. Used for looking for DEAD codes When you want to compare series graphically by having a number of lines on one chart or within Excel by downloading a number of time series requests
3. Finding Required Series Use the filter function to narrow down series available in one of two ways by clicking on the Filter button. Series Selection Window To enable equities from one market 1. Select correct Tabs 1. Select correct Tabs 2. Click + 3. Click OK 2. Type in the series name Pick stocks from a particular market AND sector 3. Ensure you have the correct series hihglighted Select Country/Sector via Host tab If you can’t find series ... Try a wild card search by prefixing a word with ‘*’ This will locate anything with ‘CHINESE’ anywhere in the title - useful if you don’t have the full company name. Use the explorer to pick out firstly a market, then a sector. Click on the folders in the left hand window. Click on ‘OK’ to drop results into Series Selection Window.
4. Selecting an Economic Series There are over 180,000 economic codes available on Datastream and it is often difficult to locate the desired series. Once you have selected Economics click on the Filter button. If you select databases you will be searching by a particular source. Simply double click on the folder that you require and your search will be narrowed down with each folder you open. You will be given 2 options to search by Local Series and All Series on Host. If you choose to search by country you can filter by sub headings ie. Labour, Key Indicators If you select local series you can add each request in using the drop down menu. If you select all series on host you will have to choose how you would like to search. Search by Country Search by Database
5. Creating a Line Chart 3. Select the Chart tab to display available charts 4. Select Line Chart 5. Check that Dates, Data and Currency are set to your requirements 6. Click Run Now to generate the report 1. Select the type of series using the selection tabs 2. Find the series you require 7. The chart is displayed in the output window
6. Creating a Comparison Chart 2. Click on Comparison Tab 3. Select the report you require 4. Find the appropriate series 5. Click Run Now when finished 6. Use the + sign to add the series to the comparison box 7. Click on the clock to select alternative date if required 8. Click on DT button to select alternative data and definitions 1. Select appropriate series tab Right click on the output screen for the menu. Use menu to take your chart into Excel, Word or PowerPoint using: Copy Copy onto clipboard and paste into any application Export Export graph as a picture Transfer Embeds the chart as a refreshable object within Excel, Word or PowerPoint (See Downloading for more information) Select Properties to edit Line Styles and Font/Text Styles
7. Ranking a List of Shares by Performance 2. Find the index required 1. Select Constituents 3. Click the Summary Tab 4. Highlight Performance Ranked 5. Click on Settings 11. Finally, click Run Now to output the list 6. Default Relative Index 7. Alternatively, click on Relative Index and type the index of your choice in the Find box. 8. Click OK 9. Remember to set your time period 10. Rank by other items
8. Downloading There are 3 different ways to download data into different applications:Copying, Exporting and Transferring. COPY. You can copy the data from any program by right clicking on the output screen and selecting the Copy option. This will send the data to the Windows clipboard for pasting into any compatible Windows application. EXPORTING. You can export data into different applications by either clicking on or by right clicking and selecting the Export option. The data can be inserted into other applications by Insert > Picture > From file (for charts) and File > Open (for data, as it will save to an excel file.) TRANSFERRING. By selecting the Transfer option you will be downloading data directly in to an application as an embedded, dynamic object. Once embedded, the requests can be refreshed within the application. You can either right click to transfer your data or you can click on Export works with static request or time series requests Once you have chosen which application you would like to transfer the data to, the following box will appear. Select Transfer As an Embedded Request if required
9. Projects Projects are a simple way of recalling frequently used reports, charts and data formats. Once you have created a Project it can be refreshed by clicking on the refresh button or by scheduling the Night Shift. Every request that is run is automatically added into the project box. Use Find if you cannot find your request 1. To create a project click here Requests 2. Run regular requests and to view the project click on Tab. 3. Requests will be stored and projects can be saved by clicking 4. By right clicking in the request area you get the following options Output You can also update projects by using the following icons Refresh current request Refresh project 5. To schedule the project to run automatically, the night shift needs to be set. This can be found in the Menu bar by selecting Tools. Select schedule for the future and amend date and time. Click on the browse button to locate your project. Add this into the box. This facility enables you to export, as well as print charts and reports as soon as they are refreshed. This facility enables you to schedule equity search formats for refreshing
10. Local Lists Local lists are a convenient way of making report, chart and data format requests. They are held locally on your PC. Advance’s Local List facilities allow you to decide what lists you need and what contents they should have. List names 1. To enter the List facility, click on the Local Lists button. List Constituents 2. To create your own local list, click List Wizard Create a Local List manually 3. Choose what type of list you want to create Edit a previously created list Download Datastream constituent lists 4. Use Help if you have a problem Download user list from Datastream 4. After you have selected an option, click Next Lists cont.
11. Creating Local Lists Manually 3. Add selected series to build up the list 1. Choose the category you want to list. 4. Give your list a meaningful name 2. Find the required series 5. When you are satisfied with your list, click Next Reminder: You can use Filter to ease the search 6. Store your list, either: Upload the list to be stored on the Datastream mainframe(see next page) OR Finish to save the list on your local drive 7. Access your list under Local Lists Amend the list by double clicking on the title Delete a series by right clicking on the selected item
12. Downloading Constituent Lists Downloading L#LISTS Industry standard or Datastream market and sector constituent lists, which are held and maintained on the mainframe can be downloaded into Advance and then maintained locally. Advance allows you to download user created lists from Datastream, for example lists created in DSWindows programs for stoarge and use in Advance. 1. Chose the list to be downloaded 1. If the L~List code is known, type it in 3. Highlight the correct list Use Filter and Browse to locate the required list 4. Click Next to continue 5. Click to delete list from Advance and Datastream 2. Or, use the Find facility, type in a keyword and hit the Find button 2. Click Next to continue 3. Give the list an appropriate name 6. Give the list an appropriate name 4. Click Finish to download the list. Note: This is a copy of the current list and will not automatically update when the constituents are changed 7. Hit Finish to download the list
13. Advance For Office (AFO) - Excel Add-in This facility allows you to embed and create Advance data requests and charts in other applications.AFO enables the user to retrieve and display data directly form Datastream through an ADD-IN Datastream-AFO removing the need to use the Advance interface. These objects can be requested as dynamic, updateable items. Downloading Data-Through AFO Click Static request For a list of items, or an individual series, at one specific date. 1. Enter the request within the Static Request Dialog Box 2. Pick instrument and series with Series Selection 3. List Picker allows you to use UCL from DSWindows, DSAdvance and AFO 4. Expression Picker allows you to download data using an expression 5. The Datatype Picker allows you to choose the items you wish to display for your series or list. Remember to request the data-type Name if it is a list. 6. Enter a Date 7. Adjust Format Options accordingly. If the Embed option is selected, the data within Excel will have links and be a dynamic updatable object AutoRefresh will update the request automatically each time the spreadsheet is opened If the Visible option is selected, a button is placed in the array, which will allow you to update the request by clicking on it whenever you require
14. Downloading Data Through AFO Allows you to specify a time period over which you can view individual series or a list of items. 2. SERIES SELECTION- Pick your instrument and choose your series 1. Enter the request within the Time Series Dialog box 3. LIST PICKER- This facility allows you to use UCL from DSWindows & Advance in AFO 4. DATATYPE PICKER- Choose the items you wish to display for your series or list. 5. Enter a fixed or relative date & submit the request Visible button option has been requested It is possible in AFO to request time series data for a list. Note that the box must be ticked Note- Editor facility allows you to amend the request
15. AFO Request Management The Request Management facility enables access to the underlying request parameters for embedded requests and charts. You can quickly pinpoint the required request and edit, refresh, autorefresh or delete its details NOTE- Option to Refresh the whole workbook 2. Select the appropriate Request and amend 1. Select the correct tab Number of actions available to the user Pick the appropriate embedded request and amend accordingly
16. Using Datastream AFO Tables The AFO Table can be obtained by selecting Datastream-AFO from the Excel Menu, Selecting Request Table then New Request Table, this will enable you to create the following; Scheduling updates, specify which request is to be updated, enabling you to increment a time series request starting at a fixed date, selecting a specific destination for output of Data as well as Charts. Any of the buttons along the top row can be copied and pasted onto other worksheets Enter Start and End dates (if required) and Frequency Select Static, Time Series, Timeseries List, Co. Accounts or Charts List Creator Option. This button will allow you to create a list for use within Advance by highlighting a list of codes ( SEDOLs, Datastream etc) from within Excel. Select required format from the list Select Yes/No to update a new or existing request Checking this box will allow you to include cell references within the series lookup column Click on the buttons to access Series Selection or list picker. Alternatively, type in a known code If no data destination is entered, data will be placed in a new sheet behind the AFO Table. Click on Data Destination to enter details of a specific spreadsheet, you only need to point to the right workbook/worksheet/cell and hit ENTER, this destination will be entered automatically.
17. Manipulating Data using Functions If you need to manipulate the data in some way, for instance, viewing the percentage change in a share price in a static request you will need to go through the following process. Click on Expression Builder to create an expression Click on to bring up items window If you have created function in DSWindows, you can type in the expression using the same syntax in this field There are a number of options for creating functions on Advance. You are able to access Datastream specific functions by clicking on . Use mathematical operators by selecting or carry out currency conversions by clicking on .
18. Manipulating Data using Functions (cont.) Using a Datastream function (e.g. Percentage Change) Pick up percentage change(period) and hit ‘OK’ Click on to select function type: Click on the blank field and then the Graph button Check this box if you want to apply this expression to any other series Click on the default time period and then select to pick your own required time period Type the required series here Type in a suitable name for the expression and select
19. DSWindows Request Equivalents Request DSWindows Program Process to Replicate Request in Advance Line Chart of a Single 401A or 401X Select your desired series and then click on tab. Select line chart series and to specify your datatype by clicking on Price Relative Chart 401B Select your desired series and then click on tab. Select Price and Price Relative Chart and specify your relative index by clicking on and select Relative Index Tab Chart of more than 401A or 401X Click on tab to select charts and either rebased or actual values option. one series Pick out your series and these to your Entries Window after ensuring you have selected your correct item by selecting . Use the pull down currency selector to pick a specific currency if required (Carries out the ~ function) Download a Time Series 900B Click on tab and select Time Series Data request. Select datatype and (with option to send to Excel) currency as in “Chart of more than one series” request. Add your series as in previous example Export to Excel by clicking on Download a Static Request 900A This would usually be run for a list of companies so you would pick a list from (with option to send to Excel) either the ‘Constituents’ or ‘Local Lists’ series tab. Click on the output tab and select “Static Data”. Select the datatype you want to view by clicking on and selecting up to nine items. Rank out a list of companies 101R Carry out same option as for previous request but select performance ranked. By their price performance Select your start date in the usual way and click on to specify a relative index as required. Performance over 3 times 101B As previous two requests but select ‘Performance over 1,3 and 12 months’. Periods Select relative index if required from within