Download
1 / 21
220 likes | 337 Views
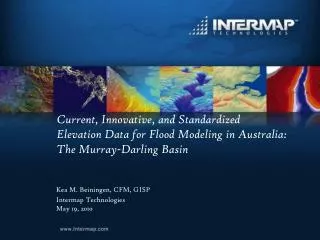
Current, Innovative, and Standardized Elevation Data for Flood Modeling in Australia: The Murray-Darling Basin. Kea M. Beiningen, CFM, GISP Intermap Technologies May 19, 2010. Water Act 2007. The purpose of the Basin Plan is to provide for the integrated

E N D
Current, Innovative, and StandardizedElevation Data for Flood Modeling in Australia:The Murray-Darling Basin Kea M. Beiningen, CFM, GISP Intermap TechnologiesMay 19, 2010
Water Act 2007 • The purpose of the Basin Plan is to provide for the integrated • management of the Basin water resources in a way that promotes • the objects of this Act, in particular by providing for: • (a) giving effect to relevant international agreements (to the extent to which those agreements are relevant to the use and management of the Basin water resources); and • (b) the establishment and enforcement of environmentally sustainable limits on the quantities of surface water and ground water that may be taken from the Basin water resources (including by interception activities); and • (c) Basin-wide environmental objectives for water-dependent ecosystems of the Murray-Darling Basin and water quality and salinity objectives; and • (d) the use and management of the Basin water resources in a way that optimizes economic, social and environmental outcomes; and • (e) water to reach its most productive use through the development of an efficient water trading regime across the Murray-Darling Basin; and • (f) requirements that a water resource plan for a water resource plan area must meet if it is to be accredited or adopted under Division 2; and • (g) improved water security for all uses of Basin water resources. © 2009 Intermap Technologies. All rights reserved.
Intermap’s Core Products DTM Digital Terrain Model DSM Digital Surface Model ORI Orthorectified Radar Image Image pixel size of 0.62 Meters 4 © 2009 Intermap Technologies. All rights reserved. © 2010 Intermap Technologies. All rights reserved.
Travellers Lake, Australia Google Earth, Spot Image DSM on top of image © 2009 Intermap Technologies. All rights reserved.
NEXTMap Specs DTM: DSM: © 2009 Intermap Technologies. All rights reserved.
Source Data Used © 2009 Intermap Technologies. All rights reserved. • Base data provided by MDBA • 568 tiles of NEXTMap data from Intermap • MGA Zone 54 projection (same as UTM 54 South) • GDA 1994 datum • Each tile • 10 km by 10 km • Array of 2000 x 2000 5-meter cells • Vertical datum is AUSGeoid98 • Vertical and horizontal units are meters • Orthorectified radar images (ORI)
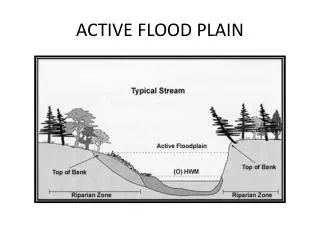
Overview © 2009 Intermap Technologies. All rights reserved. Analyzed basin: ~46,000 sq km Hydrology: Regression equations function of drainage area in square kilometers Riverine-Like Hydraulics: 2-, 10-, 50-, 100-, and 500-year return intervals for riverine areas Non-Riverine Hydraulics: Pits and ponds Floodplain Mapping: Pits & Ponds + Riverine ArcHydro data model
Assumptions & Limitations © 2009 Intermap Technologies. All rights reserved. Pilot-level study, test purposes only Highly automated, minimal human intervention Broad assumptions in certain input values Very short production time frame (December 2009) Used best available input data at time of work
Riverine-like Portions of Study Area © 2009 Intermap Technologies. All rights reserved. • Steady flow hydraulic models and mapping developed where: • Drainage areas 20 sq km or more • Contributing area completely contained by the supplied topography. • Where the reaches somewhat riverine in nature • PBS&J Rapid Floodplain Delineation (RFD) tool used • Step-backwater computation • Ability to write HEC-RAS files
Topography Used © 2009 Intermap Technologies. All rights reserved. • Common industry standard for hydrologic analysis is 30-meter cells used to develop basins and flowpaths for hydrology. • For this project, topography resampled to 25-meters (slightly smaller than typical 30-meter cell size) • Hydraulics • Resampled to a 10-meter cell size for speed of analysis reasons • Flowpaths were "splined" to smooth them out
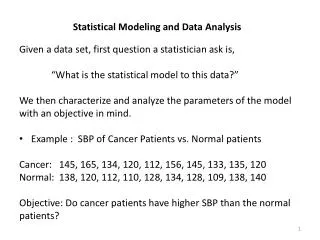
Regression Equations for Flows © 2009 Intermap Technologies. All rights reserved. • Annual peak flow gage data available for portions of region • Gage annual maximum peak flow series fitted to the Gumbel (Type 1) Extreme Value distribution. • 2-, 10-, 50-, 100-, and 500-year • Flow equation developed where drainage area was only variable
Cross Sections (XS) © 2009 Intermap Technologies. All rights reserved. • Cross Sections • RFD has several parameters that impact XS placement • For this pilot study, values set reach-by-reach in GIS • Very minimal manual manipulation of XS for this study • Standard Manning n value used
Dry Lakes and Pits / Ponds © 2009 Intermap Technologies. All rights reserved. • Only about 25% of the basin riverine-like • Rest appears has few or no discernable channels—is not riverine flow. • “Ponding" layer shows ponds & pits • In excess of about 0.3 meters in depth • And, approximately 1 hectare in surface area. • Over 50,000 polygons in the study area • Use pits-ponds layer from riverine models in conjunction with the ponding layer. • Greater extent of two layers is estimated floodplain
Murray and Darling Rivers © 2009 Intermap Technologies. All rights reserved. • Murray and Darling Rivers • Majority of contributing basins outside the study area • Effects of regulation • Modeled using historic peak flows from early 1990s • For Murray River • Flows roughly equal to 1956 flooding extents also used • ~2,265 cms U/S of the Darling • ~2,549 cms D/S of the Darling
Murray and Darling Rivers © 2009 Intermap Technologies. All rights reserved.
Floodplain MappingFlow Contained © 2009 Intermap Technologies. All rights reserved.
Floodplain MappingMurray River + Pits and Ponds © 2009 Intermap Technologies. All rights reserved.
Floodplain MappingOverlaid With Basin Boundaries © 2009 Intermap Technologies. All rights reserved.
ArcHydro © 2009 Intermap Technologies. All rights reserved. Arc Hydro Tools version 1.3 used Created after H&H modeling complete Arc Hydro preprocessing workflow used In this case, workflow begins with the flow direction grid
ArcHydro © 2009 Intermap Technologies. All rights reserved. • Drainage, Hydrography, and Network feature datasets • These are standard feature datasets in the Arc Hydro schema • Drainage feature dataset • watershed, catchment, and drainage line features • Network dataset • connectivity of the system • Hydrography dataset • Monitoring point features (gauges) • Channel feature dataset • Not included, no channel data available
What’s next??? • Intermap continuing to collect IfSAR for the rest of Murray Darling Basin & now for the Eastern part of New South Wales. © 2009 Intermap Technologies. All rights reserved.