Download
1 / 1
10 likes | 89 Views
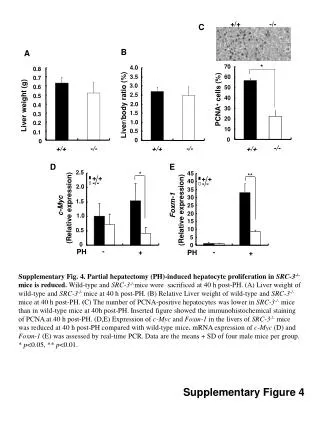
Study showing decreased liver regeneration in SRC-3-/- mice after partial hepatectomy compared to wild-type, with reduced PCNA-positive cells and c-Myc/Foxm-1 expression.

E N D
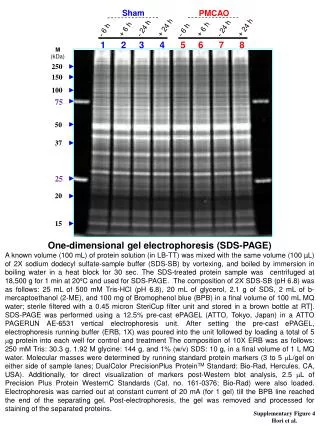
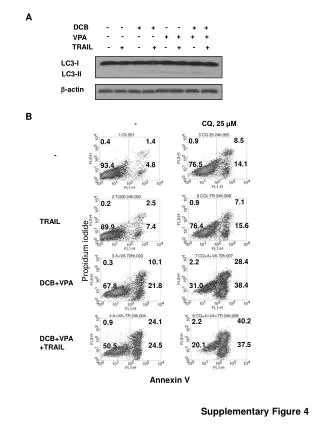
+/+ +/+ -/- -/- +/+ -/- C B A * 70 4.0 0.8 3.5 60 0.7 3.0 0.6 50 2.5 0.5 40 PCNA+ cells (%) 2.0 Liver/body ratio (%) Liver weight (g) 0.4 30 1.5 0.3 20 1.0 0.2 10 0.5 0.1 0 0 0 -/- +/+ -/- +/+ -/- +/+ D E * 2.5 ** 45 40 2.0 35 30 1.5 c-Myc (Relative expression) Foxm-1 (Relative expression) 25 20 1.0 15 10 0.5 5 0 0 - PH - + PH + Supplementary Fig. 4. Partial hepatectomy (PH)-induced hepatocyte proliferation in SRC-3-/- mice is reduced. Wild-type and SRC-3-/-mice were sacrificed at 40 h post-PH. (A) Liver weight of wild-type and SRC-3-/- miceat 40 h post-PH.(B) Relative Liver weight of wild-type and SRC-3-/- miceat 40 h post-PH. (C) The number of PCNA-positive hepatocytes was lower in SRC-3-/- mice than in wild-type mice at 40h post-PH. Inserted figure showed the immunohistochemical staining of PCNA at 40 h post-PH.(D,E) Expression of c-Myc and Foxm-1 in the livers of SRC-3-/- mice was reduced at 40 h post-PHcompared with wild-type mice. mRNA expression of c-Myc (D) and Foxm-1 (E) was assessed by real-time PCR. Data are the means + SD of four male mice per group. * p<0.05, ** p<0.01. Supplementary Figure 4