Download
1 / 16
160 likes | 257 Views
Learn the importance of observatory data in repeat station reduction and how errors can affect annual means. Understand the significance of intercomparing observatories and detecting data problems. Access tables and plots on a website for detailed information.

E N D
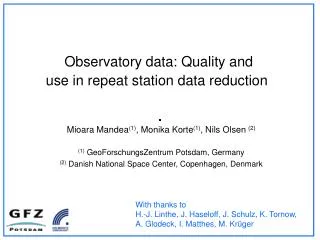
Observatory data: Quality anduse in repeat station data reduction Mioara Mandea(1), Monika Korte(1), Nils Olsen (2) (1) GeoForschungsZentrum Potsdam, Germany (2) Danish National Space Center, Copenhagen, Denmark With thanks to H.-J. Linthe, J. Haseloff, J. Schulz, K. Tornow, A. Glodeck, I. Matthes, M. Krüger
Importance of observatory data for repeat stations • Observatory variation recordings necessary for repeat station datareduction • Observatory annual means are based on hourly means • Observatory annual means are used for repeat station data reduction to “annual means” • Errors in observatory data can map directly into repeat station “annual means” C(xi,tmean) = C(xi,ti) – C(O,ti) + C(O, tmean) Repeat station“annual mean”of component C Repeat stationmeasurementvalue at time ti Observatoryannual meanof component C Observatoryrecording attime ti
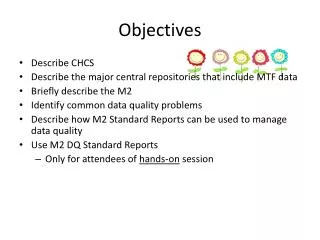
Overview over missing data • Mean daily variation per year and observatory • Comparison to CM4 model • Intercomparison of observatories This project: quality check of global observatory annual means • Aim:A high-quality set of global observatory hourly mean values for scientific studies, 1st step: 1995 to current (2003) • Data base:hourly means data base of WDC C1 for Geomagnetism, Copenhagen(now at WDC Edinburgh) • Problem:Data in the data base may contain errors- outliers- unreported base line jumps- uncorrected base line drifts • Strategy:- check all data for problems- compile a list of detected problems- encourage individual observatories to correct their data check all data for problems
CHAMBON LA FORET (CLF) NIEMEGK (NGK) Intercomparison of observatories
Intercomparison of observatories X (nT) Y(nT) Z(nT) OBS 1 OBS 2 Difference • Differences due to inhomogeneous external and induced fields depending on distance between observatories and magnetic activity • Only slow variations due to secular variation (~linear) • No sudden jumps, no strong slow variations on sub-annual scale (baseline!)
Intercomparison of observatories GOLUMD (GLM) LANZOU (LZH)
Jump ? Intercomparison of observatories X (nT) Y(nT) Z(nT) OBS 1 OBS 2 Difference Jump
Intercomparison of observatories PANAGJURISHTE (PAG) ISTANBUL (ISK) SURLARI (SUR)
Outlier ? Baseline Drift Baseline Drift Outlier ? Technical disturbance ? Jump ? Intercomparison of observatories X (nT) Y(nT) Z(nT) OBS 1 OBS 2 Difference
Outlier ? Baseline Drift Baseline Drift Outlier ? Technical disturbance ? Jump ? Intercomparison of observatories X (nT) Y(nT) Z(nT) OBS 1 OBS 2 Difference Problems in ISK Problems in SUA
Relevance for repeat station data C(xi,tmean) = C(xi,ti) – C(O,ti) + C(O, tmean) Repeat station“annual mean”of component C Repeat stationmeasurementvalue at time ti Observatoryannual meanof component C Observatoryrecording attime ti 1. Jumps within the year: - annual means incorrect (if jump not corrected)- C(O,ti) and annual means might be at different levels (if jump corrected for annual mean, but not in original variation data) 2. Base line drifts: - annual mean incorrect- reduction from a certain time of measurement to annual mean incorrect
Comparison to CM4 model CM4: quiet time model modulated with indices Dst and F10.7 solar flux(Sabaka et al., 2004)
Comparison to CM4 model - Differences Base line problem? CM4: quiet time model modulated with Dst and F10.7 solar flux indices (Sabaka et al., 2004)
High latitudes • Problem: • Strong external variations • differ a lot from year to year • differ a lot between observatories • are not sufficiently described by CM4
Conclusions • Most of the geomagnetic hourly mean values stored at the WDC C1 are of good quality but some erroneous data exist in the data base. • Comparisons of mean daily variations per year, intercomparisons between neighbouring observatories and comparisons to global models are useful methods to detect different kinds of problems. • For high geomagnetic latitudes and very remote observatories the detection of erroneous data is very challenging and not possible to the same degree of accuracy as for closely adjacent observatories at lower latitudes. • Tables and plots of identified problems are available on a website.http://www.gfz-potsdam.de/pb2/pb23/index_e.html, under link Projects: Global quality check of observatory data • However, we generally cannot explain the sources of errors. • We strongly encourage each observatory with some erroneous data to make every effort to understand the origin of the problems, correct their data and re-submit improved data to the WDC. • Repeat station data quality also depends on observatory data quality