
Numerical Descriptive Measures
E N D
Presentation Transcript
Numerical Descriptive Measures Chapter 3
Group data Vs. Ungrouped data Statistical data is of two types - Grouped and Ungrouped. Grouped data: Grouped data is the type of data which is subdivided into classes. Grouped data is not purely raw data. In fact, in grouped data, some analysis has been already done and it is classified. Ungrouped Data: Ungrouped data has not been classified or has not been subdivided in the form of groups. This type of data is totally the raw data. It is the data collected in original form. Example: The shoe sizes of 10 people in a survey are:8, 9, 9, 7, 10, 6, 7, 8, 9, 7
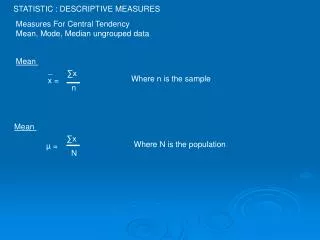
Ungrouped data • Mean: The word mean and average are used synonymously. ** x̅ denotes the mean of the data. Mean( x̅ )= Sum of values / Total number of values Mean for population data: μ = Mean for Sample data: x̅= • The value of population mean is constant • The value of sample mean varies from sample to sample • Mean is not always the best measures of central tendency because it can be influenced by outlier. (Few value are high and few are very small) Ex: Quiz one result out of 20 : 15, 0, 2, 0,5, 0, 4, 2, 6, 3, 1, 18, 20, 20. * What is the average marks in quiz one? Does it reflects the real scenario of the class? Here, N= Population size, = the sum of all values, n= Sample size μ = Population mean, x̅ = Sample mean
Ungrouped data Median: Median can be defined as the middle value in a set or distribution. - When the uneven series of values are arranged in ascending or descending order of magnitude, the value of the middle item in the series is known as the median. See ex; 3-4, pg 84* However, the set or distribution (values) has even values that case average of middle two values is called median. See ex; 3-5, pg84** The median is preferred over mean as a measure of central tendency because it is not influenced by outlier.
Mode: The mode is defined the value that most frequently occurs in the given data; i.e. the number whose frequency is more than others, is called the mode. • It is usually denoted by "Z“. • Data set with only one value occurring highest frequency is called Unimodal. • Two values that occurred same highest frequency is called Biomodal and more than two is called Multimodal modes. • Example: 3-7, 3-8, 3-9, in pg 86 Major limitations of Mode is that a data set may not have mode. Advantage of Mode is; it can be calculated for both Qualitative and quantitative data, whereas mean and median only calculate quantitative data. Example , 3-10
Relationship among Mean, Median & Mode Mean , Median & Mode
Measures of Dispersion / Variability for Ungrouped Data The mean, median & mode do not reveal a complete or sufficient description of data.- We also need a measure that can deliver some information about the variation among data values. The measures that help us learn about the spread of a data set are called the measures of dispersion. * Measures of central tendency and dispersion taken together give a better picture of a data set than the measures of central tendency alone. Following section will discuss three measures of dispersion/ variation: 1. Range2. Variance and 3. Standard deviation.
Range: Range is the difference between the largest and smallest observations or value in the data set. • Range = Largest value - Smallest value • See example 3-11 in pg 92 • Limitation of Range: • The range, like the mean, has the disadvantage of being influenced by outliers. • Excepts largest and lowest values, all other values in a data set are ignored when calculating the range.
Variation: ( ) Standard Deviation: = Population Variation S2 = Sample Variation The value of variation and Standard deviation are never Negative.
The short-cut formulas for calculating the variance and standard deviation (for ungrouped data) are given next. See Example 3-12 & 3-13 in pg 94
Population Parameters and Sample Statistics • Numerical measure such as the mean, median, mode, range, variance, or standard deviation calculated for a population data set is called a population parameter, or simply a parameter. • A summary measure calculated for a sample data set is called a sample statistic, or simply a statistic. • Thus, µ and σare population parameters, and x̅ and s are sample statistics.
Mean of Grouped Data Mean for population data: Mean for sample data: See Example 3-14 & 3-15 In Page 99, 100
Grouped data Median :
Step: 2Here, N= 192, so 192 / 2 = 96h = 5 cf = 76Median = N/2th item which lies in (15 – 20) group.=15 + * 5= 15 + 3.58= 18.58=> Median = 18.58
Variance and Standard Deviation for Grouped data = Population Variation S2 = Sample Variation Population Standard Deviation Sample Standard Deviation
The short-cut formulas for calculating the variance and standard deviation (for Grouped data) are given next. See Example 3-16, 3-17 In pg 101 n 102