Download
1 / 61
610 likes | 707 Views
Learn to interpret growth charts, assess risk of obesity-related complications, and implement effective behavior change strategies. Understand BMI calculations and referral criteria for overweight children. 8

E N D
Obesity Basics 101: Role of the Pediatrician Nancy F. Krebs, MD, MS, FAAP Sandra G. Hassink, MD, FAAP
Objectives After this session, participants will be able to… • Interpret growth charts, exam findings • Elicit focused diet and activity history • Assess risk: co-morbidities & persistence • Describe best practices for achieving behavior change; • Code strategically for reimbursement • “Practice” cases
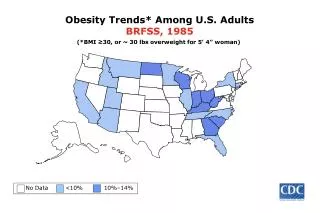
Step 1: Assess BMI / Growth Chart If there was an infectious disease that had… • double - tripled in prevalence, • was afflicting 25-30% of children of all ages, • had life life-long, potentially life threatening impact… Would we be acting? Would we take 10 sec to plot a point?
Are MD’s Using the BMI Charts? • 31 % of pediatricians: “Never” • 11% : “Always” • Use of BMI (cf ht & wt) associated with: • Greater assessment of “fatness” • Greater concern about co-morbidities • “Visual diagnosis” subject to under-diagnosis Perrin et al, J Peds 2004
Body Mass Index • Metric measurements: Weight kg Height2 m2 (weight (kg) height (cm) height (cm) • English measurements: Weight (lb) Height (in) Height (in) x 703
BMI BMI Boys: 2 to 20 years BMI BMI BMI Charts: Why BMI? • BMI body fatness • BMI = screening tool • Allows tracking of weight • relative to height • Age-specific BMI values • Identify high risk patterns: • Rapid changes in BMI • Risk of complications • Childhood BMI tracks into adulthood Referral
BMI BMI Boys: 2 to 20 years BMI BMI BMI Charts:Definitions • At risk of overweight: • 85-95th BMI % for age • Overweight: • > 95th BMI % for age Referral
Can you see risk? • 4 year old girl • Is her BMI-for-age • - 5th to <85th percentile: normal? • - >85th to <95th percentile: “at risk for overweight”? • - >95th percentile: “overweight” ? Photo from UC Berkeley Longitudinal Study, 1973
Plotted BMI-for-Age Measurements: Age=4 y Height=99.2 cm (39.2 in) Weight=17.55 kg (38.6 lb) Girls: 2 to 20 years BMI BMI=17.8 = 85-95th percentile “At risk for overweight”
Can you see risk? • 3 year old boy • Is his BMI-for-age • - 5th to <85th percentile: normal? • - >85th to <95th percentile: • - >95th percentile: overweight? CDC Photo from UC Berkeley Longitudinal Study, 1973
BMI BMI Boys: 2 to 20 years BMI BMI Plotted BMI-for-Age Measurements: Age = 3 y 3 wks Height = 100.8 cm (39.7 in) Weight = 18.6 kg (41 lb) BMI=18.3 BMI-for-age ~95th percentile “overweight”
BMI BMI Boys: 2 to 20 years BMI BMI Use of BMI: Progression of Excessive Weight Gain Referral 3 yr old boy
BMI BMI Boys: 2 to 20 years BMI BMI Use of BMI: Progression of Excessive Weight Gain Referral 3 yr old boy
Early Identification – BMI vs Visual Diagnosis 95th % >> 95th % 85-95th %
BMI: Summary • BMI > 95th % strongly correlates with body fat • BMI crossing major percentile line warrants anticipatory guidance (at minimum)
Step 2 Assessment: History, history, history!
4 Essential Components of History • Diet • Physical activity • Family History (if not known) • Review of Systems • GOALS: 1. Identify targets for behavior change 2. Assess risk (co-morbidities, risk of persistence)
Diet History: 4 points (2 B’s, 2 Fs’) • Beverages • Juice/soda/sports drinks/milk • Breakfast • Skipping meals promotes later overeating • Content? Simple carbs? • Eating routines • Fruits & vegetables • Goal 5 servings/d • Frequency of eating out (any restaurant/take out) • High risk for excessive portion sizes + high fat
Targeted Feeding History – Young Patients • Infant feeding • Bottle practices (adding cereal?) • Responsive to infant hunger cues or propping • Food choices (blueberry buckle?) • Toddlers • Beverages – juice/milk • Food choices – F/V vs sweets, French fries • Frequency/routines - grazing • Portions – toddler vs adult
Early Introduction of Solids? • 29% of infants receive solids before 4 mo • Only 6% of infants reached 6 mo w/o solids!! • > 50% of a WIC sample put cereal in bottle – “because the doctor said my milk was too thin” • Early solids (0-3 mo) = problem? • risk of developing early markers of type 1 diabetes (islet autoimmunity); • risk of obesity = ??? • Reflection of maternal/family feeding behaviors
Portion Sizes: Toddler vs Adult Recommended Serving Sizes for Toddlers: Fruits: ½ piece 2-4 oz juice Grains: ½ sl bread ¼ - ½ c pasta Milk: 4 oz x 4/d
Feeding practices & structure • Family meals • F/V; soft drinks • Structured eating routines • (not grazing, not skipping meals) • Avoid eating in front of TV • F/V, soft drinks • TV time, probability of TV in bedroom • Present appropriate portions “You provide, they decide” (NFK: to a point!!)
Portion Sizes & Intake: Children • Doubling an age - appropriate portion of entrée 25% entrée & 15% total energy intakes • Children consumed 25% less of an entrée when allowed to serve themselvesvs. being served a large portion • (Stomach size of child’s fist) • Fisher et al, AJCN, 2003 **P<.01
Diet History: 4 points (2 B’s, 2 Fs’) • Beverages • Juice/soda/sports drinks/milk • Breakfast • Skipping meals promotes later overeating • Content? Simple carbs? • Eating routines • Fruits & vegetables • Goal 5 servings/d • Frequency of eating out (any restaurant/take out) • High risk for excessive portion sizes + high fat
Physical Activity Hx: 4 points (SSOB) • Screen time - hr/day • TV, video, video games, computer • TV in bedroom? • Sports/organized physical activity • Outdoor time • After-school, weekend activities (w/ family?) • Barriers • To walking/biking to school, free play
Limit Screen Time • energy expenditure w/ physical activity (TV < videogames, school work, arts) • energy intake – during or from ads • Low income preschoolers: • 40% with TV in bedroom • TV in bedroom α TV hrs & overweight • Reduction of TV time: relative in BMI • AAP: NO TV < 2 yr
Promote Physical Activity • Unstructured gross motor play important for development: • Brain/cognitive • Social & emotional • Parental support for child’s activity positively associated w/ children’s level of activity • Outdoor time is one of strongest predictors of children’s overall activity level
Kids CAN Now Be Little Adults! • Stroller capacity now for children 4-6 yr olds • 45 lb in front, 50 lb back capacity (max = 66 lb) • “Safer & faster” in crowds • Accessories: cup holders, food tray, cell phone pocket, storage bins, “all terrain wheels” • “Containerizing children?” $149.99 (Amazon.com)
Physical Activity: Issues • Environments/facilities • Safety (developmental benefit vs risks) • Family structures/working parents / busy schedules • Encourage 60 min sedentary time at a stretch
Physical Activity Hx: 4 points (SSOB) • Screen time - hr/day • TV, video, video games, computer • TV in bedroom? • Sports/organized physical activity • Outdoor time • After-school, weekend activities (w/ family?) • Barriers • To walking/biking to school, free play
Family Hx: Risk for Persistence • 1 parent ob: O.R. = 3 • 2 parent ob: O.R. > 10 • < 3 yr, parental obesity stronger predictor cf child’s weight
Family History: Risk of Co-morbidities • Obesity • Cardiovascular disease • Hyperlipidemia/metabolic syndrome • Hypertension • Type 2 diabetes • Psychologic history • Depression, disordered eating
Risk Factors for Co-Morbidities HistoryCondition? • Developmental delay Genetic disorder • Poor linear growth Endocrinopathy • Headaches Pseudotumor • Night-time breathing problems Sleep apnea • Daytime sleepiness Sleep apnea • Abdominal pain Gall bladder dis • Hip or knee pain Slip cap fem epiph • Menstrual abnormalities PCO • Binge eating/purging Eating disorder
Physical Exam Findings • Short stature • Depressed affect • blood pressure • Skin: acanthosis nigricans, dark striae • Eyes: papilledema • Hepatomegaly • Extremities (tenderness, small hands/feet, bowed legs) • Neuro – DTR’s
Labs - Considerations • Risk factors, impact on treatment, motivation, cost • Fasting: • Lipoprotein profile • Glucose (+/- insulin?) • 10 yr, BMI 85th %, + FHx/non-Caucasian/Signs of insulin resistnance (2/3) • Hepatic transaminases • ? Glucose tolerance • ? Sleep study • ? ECHO
Principles of Treatment • Assess – USE BMI Charts!! • Readiness to change • Barriers to change (“What’s going to be hard?”) • Motivators for change (variable; kid vs parent) • Involve patient/parent in identifying changes • Family involvement • BOTH eating/diet + physical activity recommendations (esp for Rx) • Value the child See Barlow et al, Pediatrics 1998;102(3)
Principles of Treatment • Establish rapport • Who is this person? • Typical day • Set the agenda • Multiple behaviors: Which is patient most interested in changing? Diet, activity? • Single behaviors (I’m concerned about…) • Assess Confidence & Importance • Scale 0-10 • Why isn’t the number lower? [Adapted from Rollnick et al, Health Behavior Change]
Guiding Principles • Effective communication • “Are you concerned about your child’s weight?” • “I’m concerned [child’s] weight is getting ahead of his height.” • To older child: “Is your weight ever a problem for you?” • Beware/avoid pejorative terms (obesity) • Negotiate for family change
Principles of Treatment • Diet: simple & explicit • Physical activity: choice, fun • Goals & rewards • Proximal vs distal, weight vs behavior • Individualized joint problem solving – choose a few things • Barriers to change usually bigger problem than motivation; choose your “battles” • Avoid being judgmental & avoid stigmatization
Goals, Strategies, Targets: General to Specific GoalStrategyTarget Wt fatty foods Cut out fried potatoes Change to low fat milk Eat new food Eat one fruit every day Be more active Walk to/from school [x] d/wk Limit TV to 2 hr/d max [Adapted from Rollnick et al, Health Behavior Change]
Motivators for Children • Fun • Challenge “Ask for less, they’ll give you more” • Responsive to peer/social approval (want to please adults) • Sensitive to looks • Social interaction • Simple & explicit “If you can’t count it, you can’t change it”
4 Components of Behavioral Strategies • Clean up /Control the environment • E.g. Eliminate sugar sweetened beverages from home; serve fruits & veg • Self-monitoring behavior • Set achievable, specific goals “If you can’t count it you can’t change it” • Rewarding successful behavioral change E.g. Praise, privileges, time w/ parents; food, $$$ Dietz & Robinson, NEJM, 2005