Download
1 / 1
10 likes | 168 Views
General Depth Calculations, Continued. Using Mine Detection Algorithms for Bridge Deck Surface Removal. Raw Data Files. General Depth Calculations. Using Mine Detection Algorithms, Continued. North Grand Island Bridge, NY. Using Mine Detection Algorithms, Continued.

E N D
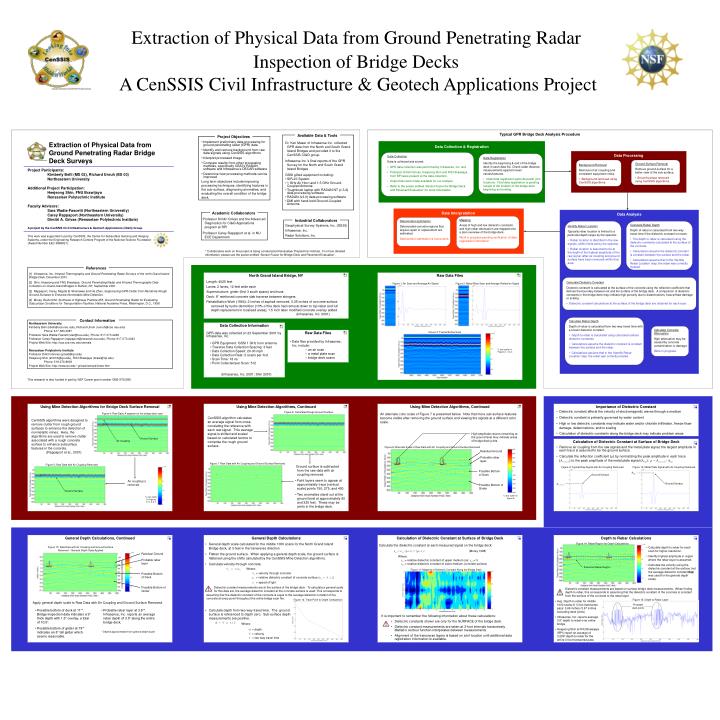
General Depth Calculations, Continued Using Mine Detection Algorithms for Bridge Deck Surface Removal Raw Data Files General Depth Calculations Using Mine Detection Algorithms, Continued North Grand Island Bridge, NY Using Mine Detection Algorithms, Continued Calculation of Dielectric Constant at Surface of Bridge Deck Importance of Dielectric Constant Depth to Rebar Calculations Extraction of Physical Data from Ground Penetrating Radar Bridge Deck Surveys Figure 14: Rebar Region for Depth Calculations • Dielectric constant affects the velocity of electromagnetic waves through a medium • Dielectric constant is primarily governed by water content • High or low dielectric constants may indicate water and/or chloride infiltration, freeze-thaw damage, delaminations, and/or scaling • Calculation of dielectric constants along the bridge deck may indicate problem areas • General depth scale calculated for the middle 1000 scans for the North Grand Island • Bridge deck, at 3-feet in the transverse direction • Flatten the ground surface. When applying a general depth scale, the ground surface is • flattened using the shifts calculated by the CenSSIS Mine Detection algorithms. Figure 6: Calculated Rough Ground Surface Calculate the dielectric constant at each measured signal on the bridge deck: Length: 4025 feet Lanes: 2 lanes, 12 feet wide each Superstructure: girder (first 3 south spans) and truss Deck: 9” reinforced concrete slab traverse between stringers Rehabilitation Work (1984): 2 inches of asphalt removed, 0.25 inches of concrete surface removed by hydro-demolition (10% of the deck had removal down to top rebar and full depth replacement in localized areas), 1.5 inch latex modified concrete overlay added (Infrasense, Inc. 2001) An alternate color scale of Figure 7 is presented below. Note that more sub-surface features become visible after removing the ground surface and viewing the signals at a different colorscale. Figure 1: Air Scan and Average Air Signal Figure 2: Metal Plate Scan and Average Reflection Signal Figure 13: Raw Data with Air Coupling and Ground Surface Removed – General Depth Scale Applied • Calculate depth to rebar for each scan for higher resolution. • Identify highest amplitude in region where the rebar layer is assumed. • Calculate the velocity using the dielectric constant at the surface (not the average dielectric constant that was used for the general depth scale). CenSSIS algorithm calculates an average signal from cross-correlating the reference with each raw signal. This average signal is shifted and scaled based on calculated factors to comprise the rough ground surface. CenSSIS algorithms were designed to remove clutter from rough ground surfaces to enhance the detection of nonmetallic mines. Here, the algorithms are used to remove clutter associated with a rough concrete surface to enhance subsurface features in the concrete. (Rappaport et al., 2001) r2=r1(+1)2/(-1)2 (Morey 1998) Where: r1= relative dielectric constant of upper medium (air, r1=1) r2= relative dielectric constant of lower medium (concrete surface) Residual Ground • Data Registration • Identify the beginning & end of the bridge deck in each data file. Check radar distance measurements against known values/features. • Initial data registration performed with joint locations. Final data registration is pending receipt of the location of the bridge deck beginning and ending. Figure 4: Raw Data: A segment of the bridge deck scan Probable rebar layer • Calculate velocity through concrete. Project Participants: Kimberly Belli (MS 02), Richard Unruh (BS 03) Northeastern University Additional Project Participation: Heejeong Shin, FNU Brawijaya Rensselaer Polytechnic InstituteFaculty Advisors: Sara Wadia-Fascetti (Northeastern University) Carey Rappaport (Northeastern University)Dimitri A. Grivas (Rensselaer Polytechnic Institute) A project by the CenSSIS Civil Infrastructure & Geotech Applications (CI&G) Group. Assumed Rebar Region High amplitude returns remaining at the ground level may indicate areas of bridge deck joints Vc = c/c Figure 11: Mapping of Dielectric Constant Along the Bridge Deck Where: Vc = velocity through concrete c = relative dielectric constant of concrete surface (c = 8.11) c = speed of light Calculation of Dielectric Constant at Surface of Bridge Deck Possible Bottom of Deck • Remove air coupling from the raw signals and the metal plate signal, the largest amplitude in each trace is assumed to be the ground surface. • Calculate the reflection coefficient () by normalizing the peak amplitude in each trace (trace) to the peak amplitude of the metal plate signal (mp): = trace/mp Figure 8: Alternate Scale of Raw Data with Air Coupling and Ground Surface Removed Ground Surface Air Coupling Residual Ground Data Collection Information Dielectric constant measurements are at the surface of the bridge deck. To calculate a general scale for this data set, the average dielectric constant at the concrete surface is used. This corresponds to Possible Bottom of Girder Dielectric constant measurements are based on surface bridge deck measurements. When finding depth to rebar, this corresponds to assuming that the dielectric constant of the concrete is constant from the surface of the concrete to the rebar layer. Probable rebar layer assuming that the dielectric constant of the concrete is equal to the average dielectric constant of the concrete at every point throughout the entire bridge scan file. Figure 7: Raw Data with Air Coupling and Ground Surface Removed Figure 3: Typical Bridge Scan Raw Data Files GPR data was collected on 22 September 2001 by Infrasense, Inc. Figure 9: Typical Raw Signal with Air Coupling Removed Figure 15: Depth to Rebar Layer Figure 10: Metal Plate Signal with Air Coupling Removed • Ground surface is subtracted from the raw data with air coupling removed. • Faint layers seem to appear at approximately trace (vertical scale) points 150, 275, and 400. • Two anomalies stand out at the ground level at approximately 50 and 325 feet. These may be joints in the bridge deck. Figure 5: Raw Data with Air Coupling Removed Figure 12: Trace Point to Depth Comparison • Avg. Depth to rebar for middle 1000 scans of 3-foot transverse pass: 3.66 inches (3.67 inches excluding deck joints) • Infrasense, Inc. reports average 3.5” depth to rebar over entire bridge • Heejeong Shin & FNU Brawijaya (RPI) report an average of 3.299” depth to rebar for the entire 3-foot transverse pass Probable deck joints mp Apply general depth scale to Raw Data with Air Coupling and Ground Surface Removed. Possible Bottom of Deck Ground Surface • Data files provided by Infrasense, Inc. include: • an air scan • a metal plate scan • bridge deck scans • GPR Equipment: GSSI 1 GHz horn antenna • Traverse Data Collection Spacing: 3 feet • Data Collection Speed: 20-30 mph • Data Collection Rate: 2 scans per foot • Scan Time: 18 ns • Point Collected per Scan: 512 • Calculate depth from two way travel time. The ground surface is referenced to depth zero. Sub-surface depth measurements are positive. • Possible bottom of deck at 11”*. Bridge inspection data indicates a 9” thick depth with 1.5” overlay, a total of 10.5”. • Possible bottom of girder at 19”* indicates an 8” tall girder which seems reasonable. • Probable rebar layer at 3.6”*. Infrasense, Inc. reports an average rebar depth of 3.5” along the entire bridge deck. • * Depths approximated from general depth scale Longitudinal Distance (feet) trace Air coupling is removed. Ground Surface C-axis scale for Figures 1, 2 & 3 It is important to remember the following information about these calculations: • Dielectric constants shown are only for the SURFACE of the bridge deck. • Dielectric constant measurements are taken at 3-foot intervals transversely. Matlab’s contour function interpolates between measurements. • Alignment of the transverse layers is based on joint location until additional data registration information is available. Possible Bottom of Girder d = V x t/2 Ground Surface Where: d= depth V= velocity t= two way travel time C-axis scale for Figure 8 C-axis scale for Figures 4, 5, 6, & 7 This work was supported in part by CenSSIS, the Center for Subsurface Sensing and Imaging Systems, under the Engineering Research Centers Program of the National Science Foundation (Award Number EEC-9986821). (Infrasense, Inc. 2001; Shin 2001) Project Objectives Available Data & Tools • Implement preliminary data processing for ground penetrating radar (GPR) data • Identify and remove background from raw data signals using CenSSIS algorithms • Interpret processed image • Compare results from other processing methods, specifically GSSI’s RADAN software and Infrasense’s DECAR software • Determine how processing methods can be improved • Dr. Ken Maser of Infrasense Inc. collected GPR data from the North and South Grand Island Bridges and provided it to the CenSSIS CI&G group. • Infrasense Inc.’s final reports of the GPR Survey for the North and South Grand Island Bridges • GSSI gifted equipment including: • SIR-20 System • 1 GHz Air Horn and 1.5 GHz Ground-Coupled Antenna • Toughbook laptop with RADAN NT (v 3.2) data processing software • RADAN (v3.0) data processing software • DMI with hand-held Ground-Coupled Antenna Typical GPR Bridge Deck Analysis Procedure Data Collection & Registration • Data Collection • Data is collected and stored. • GPR data collection was performed by Infrasense, Inc. and • Professor Dimitri Grivas, Heejeong Shin and FNU Brawijaya, • from RPI were present at the data collection. • Output files were made available for our analysis. • Refer to the poster entitled ‘Sensor Fusion for Bridge Deck • and Pavement Evaluation’ for more information. Data Processing Long term objectives include improving processing techniques, identifying features in the sub-surface, diagnosing anomalies, and evaluating the overall condition of the bridge deck. • Ground Surface Removal • Remove ground surface for a better view of the sub-surface. • Ground surface removed using CenSSIS algorithms. • Background Removal • Removal of air coupling and consistent equipment noise. • Background removed using CenSSIS algorithms. Academic Collaborators Professor Dimitri Grivas and the Advanced Diagnostics for CI&G Applications program at RPI Professor Carey Rappaport et al. in NU ECE Department Industrial Collaborators Geophysical Survey Systems, Inc. (GSSI) Infrasense, Inc. Radar Solutions, Inc. Data Interpretation Data Analysis Mapping Areas of high and low dielectric constants and high rebar attenuation are mapped onto a plan overview of the bridge deck. Work in progress pending verification of data registration information. Deterioration Estimation Deteriorated concrete regions that require repair or replacement are estimated. Deterioration estimation is future work. • Calculate Rebar Depth • Depth of rebar is calculated from two-way travel time if the dielectric constant is known. • The depth to rebar is calculated using the dielectric constants calculated at the surface of the concrete. • Calculations assume the dielectric constant is constant between the surface and the rebar. • Calculations assume that in the ‘Identify Rebar Location’ step, the rebar was correctly located. • Identify Rebar Location • Typically rebar location is limited to a particular depth range by the operator. • Rebar location is identified in the raw signals, within limits set by the operator. • Rebar location is assumed to be at the depth of the highest amplitude of the raw signal (after air coupling and ground surface have been removed) within that area. * Collaborative work on the project is being conducted at Rensselaer Polytechnic Institute. For more detailed information, please see the poster entitled ‘Sensor Fusion for Bridge Deck and Pavement Evaluation’. References [1] Infrasense, Inc. Infrared Thermography and Ground Penetrating Radar Surveys of the north Grand Island Bridge Deck, December 2001. [2] Shin, Heejeong and FNU Brawijaya. Ground Penetrating Radar and Infrared Thermography Data Collection on Grand Island Bridges in Buffalo, NY, September 2001. [3] Rappaport, Carey, Magda El-Shenawee and He Zhan, Suppressing GPR Clutter from Randomly Rough Ground Surfaces to Enhance Nonmetallic Mine Detection. [4] Morey, Rexford M. Synthesis of Highway Practice 255, Ground Penetrating Radar for Evaluating Subsurface Conditions for Transportation Facilities. National Academy Press, Washington, D.C., 1998. • Calculate Dielectric Constant • Dielectric constant is calculated at the surface of the concrete using the reflection coefficient that defines the boundary between air and the surface of the bridge deck. A comparison of dielectric constants in the bridge deck may indicate high porosity due to delaminations, freeze/thaw damage or scaling. • Dielectric constant calculations at the surface of the bridge deck are obtained for each scan. Contact Information Northeastern University Kimberly Belli (kbelli@coe.neu.edu), Richard Unruh (runruh@coe.neu.edu) Phone: 617-383-3987 Professor Sara Wadia-Fascetti (swf@neu.edu), Phone: 617-373-4248 Professor Carey Rappaport (rappaport@research.neu.edu), Phone: 617-373-2043 Project Web Site: http://sca.coe.neu.edu/censsis Rensselaer Polytechnic Institute Professor Dimitri Grivas (grivad@rpi.edu) Heejeong Shin (shinh3@rpi.edu), FNU Brawijaya (brawi@rpi.edu) Phone: 518-276-8609 Project Web Site: http://www.rpi.edu/~grivad/censsis/index.htm • Calculate Rebar Depth • Depth of rebar is calculated from two-way travel time with a known dielectric constant. • Depth to rebar is calculated using calculated surface dielectric constants. • Calculations assume the dielectric constant is constant between the surface and the rebar. • Calculations assume that in the ‘Identify Rebar Location’ step, the rebar was correctly located. Calculate Concrete Attenuation High attenuation may be caused by concrete contamination or damage. Work in progress. This research is also funded in part by NSF Career grant number CMS-9702656. Extraction of Physical Data from Ground Penetrating Radar Inspection of Bridge Decks A CenSSIS Civil Infrastructure & Geotech Applications Project