Download
1 / 56
560 likes | 644 Views
Explore the feasibility of monitoring rogue nuclear activity using an array of antineutrino detectors, discussing detector specifications, detection mechanisms, costs, challenges, and detection strategies.

E N D
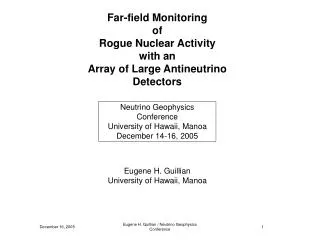
Far-field Monitoring of Rogue Nuclear Activity with an Array of Antineutrino Detectors Neutrino Sciences 2005 Neutrino Sciences 2005 University of Hawaii, Manoa University of Hawaii, Manoa December 14-16, 2005 December 14-16, 2005 Eugene H. Guillian University of Hawaii, Manoa Eugene H. Guillian University of Hawaii, Manoa
Small! Hard to Detect! Rogue Nuclear Activity Typical commercial reactor ≈ 2500 MWth Little Boy ≈ 15 kiloton Fat Man ≈ 23 kiloton
These factors strongly constrain the detector & array specifications Far-Field Monitoring Uncooperative Regime Access within ~100 km not allowed Far Away Small event rate (1 / distance2) • Large Detector • Shielding from cosmic rays • Detector must be affordable
Detector must be on the order of 106 m3 100 m 100 m 100 m Water is the only economically feasible target • H2O loaded with 0.2% GdCl3 • C.f. GADZOOKS! (Super-K with GdCl3) J. F. Beacom & M. R, Vagins, Phys. Rev. Lett. 93, 171101 (2004) Antineutrino Detector Module Specification • Far-field monitoring • Distance > ≈ 100 km
Prompt Event Cherenkov radiation ≈ 20µs Delayed Event n + Gd Gd + g cascade Evis ≈ 3~8 MeV Detection Mechanism Inverse Beta Decay
Neutrino Energy Spectrum • GADZOOKS! Threshold • En > 3.8 MeV • KamLAND Threshold • En > 3.4 MeV GADZOOKS! Efficiency 58% of entire spectrum (En > 1.8 MeV) 82% of KamLAND efficiency
~$120 Million @ $1000 per unit ~$10 Million @ $3 / kg 100 m Cost? 100 m 100 m The cost of just one module looks to be easily about $500 Million! A Very Basic Look at a Megaton Detector Module Photo-Sensor Requirement ≈ 120,000 units (10 Super-Kamiokande) Gadolinium 2000 metric tons Water Purification 200 Super-Kamiokande’s capacity
Is a Megaton Module Outlandish? • Challenges • Deep-Ocean environment • Remote operations • Mega-structure engineering The linear dimensions are not that much larger than those of Super-Kamiokande
Unstable nuclei Sometimes indistinguishable from antineutrinos! Cosmic Ray Background • Like bullets! • Occasionally they destroy atomic nuclei
Shielding from Cosmic Rays Super-Kamiokande • Shielded by 1000 m of rock (equivalent to 2700 m of water) • Mitsui Mining Co. property Super-Kamoikande (and similar experiments) would have cost too much if shielding had to be erected from scratch! For the megaton module array, we assume that cost of shielding on land is prohibitive. Ocean & Lake = Affordable Shielding
Module positions can be optimized because of prior knowledge of likely locations Can’t optimize module positioning • Larger Modules Required • 10 Megatons • 1 year exposure • Smaller Modules Will Do • 1 Megatons • 1 year exposure Array Configurations
Global Array 15º 5º Array Total of 1596 modules
Global Array 2Equidistant Array Total of 623 modules Minimum nearest-neighbor distance ≈ 600 km
Global Array 3Coast-hugging Array Total of 1482 modules Minimum nearest-neighbor distance ≈ 100 km Modules removed from coast line by ≈ 100 km
Regional ArrayNorth Korea • 250 MWth fission reactor deep inside of North Korea • Background from commercial nuclear reactors Choose locations based on sensitivity map (red dots are candidate module positions)
Rogue Activity Detection Strategy (1) Assume that no rogue activity is taking place (2) If this assumption is incorrect AND if the rogue activity is sufficiently large, there would be a discrepancy between observation & expectation (3) Use a statistical technique (minimum log-likelihood) to estimate the position & power of the rogue activity
With rogue activity, module 1, 2, and 3 sees an extra S1, S2, and S3 events Illustration of the Detection Strategy If no rogue activity takes place, module 1, 2, & 3 detects B1, B2, and B3 events The size of the excess goes as: Power / Distance2
Observed Number of Events Observed Number of Events Random Statistical Fluctuation Large Signal + Background Background only Small Signal + Background Seeing the Rogue Activity Above Random Fluctuations
S = # signal events Signal Strength = statistical uncertainty S S B = # background events Signal Strength
Map of Signal Strength Rogue Activity 2000 MWth
Equidistant Detector Array Configuration 10 Megaton per module 1 year exposure
Cluster of nearby detector modules with significant excess Pin-Pointing Rogue activity location given roughly by the position of the cluster • Cutting on Signal Strength • Tight cut low background noise, but loss of signal • Loose cut more signal, but more background noise Measuring Power Use log-likelihood to obtain the most likely power Remarks on Rogue Activity Detection Rogue Activity: Has sufficiently large power Is sufficiently close to detector modules
P99: Benchmark for Array Performance • Log-likelihood Function • A statistical tool used for • hypothesis testing • Hypothesis • No rogue activity is taking place • Information Used in Log-likelihood Function • Expected number of background • events in each detector (from • commercial nuclear reactors) • Observed number of events in • eachdetector • The log-likelihood value is not defined • a priori because of random fluctuations in • the measurement • Its distribution, however, is defined a priori
99% of measurements give log-likelihood above the alarm threshold 1% of measurements sets off false alarm 1% False Positive
Rogue Reactor Exists Hypothesis Incorrect Log-likelihood function is biased to lower values Rogue Reactor Power is Weak Large overlap between observed vs. expected distributions Can’t reliably detect rogue activity Unacceptably Large Frequency of False Negatives
Definition of P99 P99 = Rogue reactor power which gives 1% chance of false negative
Global Array Performance • For each array configuration, make a map of P99 • Procedure for making map: • Vary the rogue reactor position • At each location, determine P99
P99 Map: 5º 5º MWth
Scaled to 1596 Modules P99 Map: Equidistant MWth
Scaled to 1596 Modules P99 Map: Coast-hugging MWth
P99 Summary 5º 5º Equidistant Coast-Hugging
Signal Regional Monitoring Example: • A rogue reactor in North Korea Background Signal Strength
Detector Locations 23 candidate locations based on map of sensitivity
Performance of Various Array Configurations Consider configurations with 2, 3, and 4 detector modules • For each configuration, determine: • P99 • Estimated area that contains rogue reactor
Two Modules P99 = 250 MWth 99% Confidence 95% Confidence
Two Modules P99 = 120 MWth 99% Confidence 95% Confidence
Three Modules P99 = 626 MWth 99% Confidence 95% Confidence
Four Modules P99 = 336 MWth 99% Confidence 95% Confidence
Four Modules P99 = 502 MWth 99% Confidence 95% Confidence
Total commercial nuclear activity ≈ 1 TWth What if a Georeactor Exists? • The Georeactor Hypothesis: • Unorthodox, but surprising things can happen…. • If it does exist, its power is likely to be 1~10 TWth If a terawatt-level georeactor does exist, the background level for rogue activity monitoring increases significantly!
log10 Background No Georeactor Ratio 3 TWth / No Georeactor log10 Background 3 TWth Georeactor
Conclusion • One module costs several hundred million dollars • multiply this by number of modules in array • A terawatt-level georeactor increases the background level by a factor of several in most locations around the world • A regional monitoring regime seems not-too-outlandish
Antineutrino Detection Rate for H2O + GdCl3 Detector • Reactor • Assume 100% detection efficiency for En > 1.8 MeV • Fission Bomb • Assume 100% detection efficiency for En > 1.8 MeV • Integrated over 10 sec. burst time
Antineutrino Detection Rate for H2O + GdCl3 Detectors • Reactor • Assume 100% detection efficiency for En > 1.8 MeV • Fission Bomb • Assume 100% detection efficiency for En > 1.8 MeV • Integrated over 10 sec. burst time