Download
1 / 26
260 likes | 381 Views
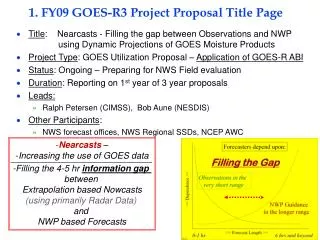
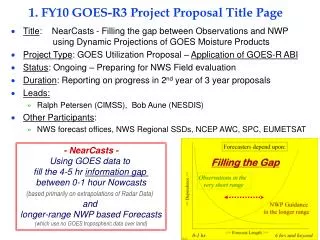
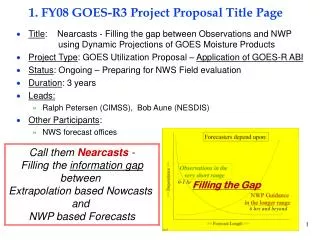
Ingrid Guch Director, Cooperative Research Program NOAA/NESDIS CICS Science Meeting Sep 8-9 2010. nesdis CoRP , SOCD and GOES-R3. Cooperative Research Program (“ CoRP ”) Challenge.

E N D
Ingrid Guch Director, Cooperative Research Program NOAA/NESDIS CICS Science Meeting Sep 8-9 2010 nesdisCoRP, SOCD and GOES-R3
Cooperative Research Program (“CoRP”) Challenge To be a Coast-to-coast government and university-based research coalition for remote sensing in the environment
The Federal Side • Three Federal Branches collocated with universities • Regional Atmospheric Mesoscale Meteorology Branch at CSU • Advanced Satellite Products Branch at UW • Satellite Climate Studies Branch at UMD
The Academic Side STAR research areas, outreach and workforce planning are touched on by all CIs and CSC. Science areas chosen to match STAR organizational topics (satellite studies in meteorology, ocean and climate)
Research Partnerships • Driven by interests, knowledge, abilities, funding, relationships, requirements, challenges • Effectively using the billion-dollar satellite constellation is a complex, multi-disciplinary problem that requires partnerships • Limited funding and resources • Limited time • Partnerships with the international community, government and non-government organizations and the private sector are as critical as federal/academic partnerships, but not the focus of current CoRP Program
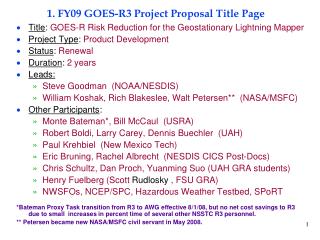
CoRP Engagement Strategies • Collocation of scientific branches with universities • Day to day interactions extremely beneficial to both NOAA and Universities • Annual Directors meeting for strategic planning • STAR/NCDC/CIRA/CIMSS/CICS/CIOSS/CREST • Satellite Algorithm Test Bed, National Climate Service and Satellite Data Assimilation current topics of high interest • Annual Science Symposium • Student and Early Career Scientist exchanges • Internal Funding Opportunity Blog www.corpblogspot.org • “End of Year” Program • GOES-R Risk Reduction • Jobs for NESDIS and STAR partners
Ultimate Goal • Highly successful scientists and science managers making revolutionary progress using the next generation of earth observation satellites for societal benefits
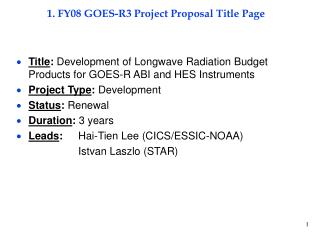
Dr. Paul M. DiGiacomo, SOCD Chief Email: Paul.DiGiacomo@noaa.gov Laboratory for Satellite Altimetry (LSA) Dr. Laury Miller, LSA Chief Marine Ecosystems and Climate Branch (MECB) Dr. CelsoBarrientos, MECB Chief (Acting) Ocean Sensors Branch (OSB) Dr. Alexander “Sasha” Ignatov, OSB Chief Satellite Oceanography &Climatology Division (SOCD)NOAA-NESDIS-STAR
Sea Level Rise Budget SLtotal= SLsteric+ SLmass The rate of sea level rise measured by Jason-1 and Jason-2 is consistent with the rate of rise from the combination of steric sea level from Argo profiles and ocean mass inferred from the GRACE gravity mission. Blue lines: Direct observations Red lines: Inferred from budget equation Leuliette and Miller [GRL,2009].
Ocean Color Remote Sensing of Water Turbidity Diffuse attenuation coefficientKd is a measure of the water turbidity (clear water with low Kd). A new satellite Kd product developed by SOCD can provide quantitative assessments and monitoring of coastal water quality, especially in important regions such as Chesapeake Bay
Coral Reef Watch • Climate Change • One of NOAA’s top 3 reef threats • High temperatures cause coral bleaching • Coral Reef Watch Products • Help resource managers conserve coral reefs Mission: To provide remote sensing tools for the conservation of coral reef ecosystems http://coralreefwatch.noaa.gov/ Bleaching Alert Areas
POES-GOES Blended SST Analysis December 31 2007 December 31 2007 December 31 2007 RTG_HR SST Daily OI SST POES_GOES Point-for-point comparison with RTG_HR shows S.D. of 0.45 K Comparison with Reynolds ¼° daily OI has S.D. of 0.65 K Only non-MW SST analysis to show “split-Gulf Stream” feature
STAR ASCAT Wind Product Improvements: North Pacific Extratropical Storm Example QuikSCAT data reveals area of HURRICANE force winds New STAR ASCAT wind product detects STORM force wind. One warning category lower Operational ASCAT wind product detects only GALE force wind. Two wind warning categories lower than the actual winds.
SST: Near-real time web-based SST Quality Monitor (SQUAM): Used by NESDIS, NCEP, NAVO, Meteo FRANCE, GHRSST • The SST Quality Monitor (SQUAM) is a web-based near-real time tool. Currently, SQUAM monitors AVHRR products from NOAA-16, -17, -18, -19, and MetOp-A. • Objectives of SQUAM: • Monitor SST products online for self-, cross-product and cross-platform consistency; • quickly identify deficiencies & areas for improvement; • establish benchmark SST metrics for quick evaluation of SST products in NPOESS/JPSS era http://www.star.nesdis.noaa.gov/sod/sst/squam/ • SQUAM Tool used by: • SST Team to improve quality of SST products • NCEP SST Team to validate and improve global analyses products • NAVOCEANO, Meteo FRANCE, GHRSS to validate and improve SST products • Will be also used for NPOESS/JPSS Cal/Val
Coastal Optical Characterization Experiment (COCE) – participated in Ligurian Sea Cal/Val NATO Cruise in August/September 2010. This is part of an ongoing inter-comparison of in-situ cal/val technologies that will be used to intercalibratebio-optical in-situ instruments with the MOBY, and Boussole moorings. Tentative Station Locations Tentative glider mission plans
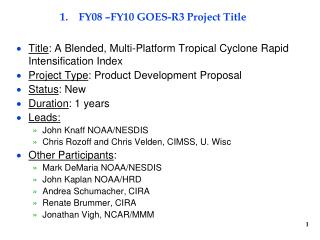
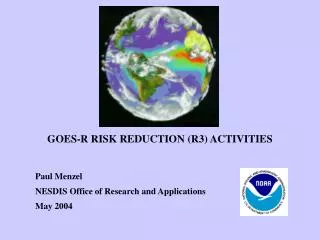
Ingrid Guch Director, Cooperative Research Program NOAA/NESDIS CICS Science Meeting Sep 8-9 2010 GOES-R Risk Reduction
Improvements over current capabilities: • Imager (ABI) - Improved resolution (4x), faster coverage (5X), more bands (3X) and more coverage simultaneously • Lightning detection (GLM) - Continuous coverage of total lightning flash rate over land and water • Solar/Space Monitoring (SUVI/EXIS/SEISS/MAG) - Better Imager (UV over X-Ray) and improved heavy ion detection, adds low energy electrons and protons
Vision for GOES-R3 • Capable, informed users • Flexible inventive providers • Knowledge brokers that recognize new connections between capabilities and needs • Champions of new opportunities
GOES-R Risk Reduction covers items necessary for GOES-R success but not covered by AWG or Proving Grounds • Exploratory Algorithms, New Products and Applications • Multisensor (at least one GOES-R sensor) • Multisatellite (at least one is GOES-R) • Data assimilation and nowcasting • Space Weather • GOES-R demonstrations and training • Demonstrate new GOES-R capabilities to public and private sector users in an efficient, timely manner • “Science Arm” of GOES-R Proving Ground • Training leverages NESDIS Cooperative Institute heritage in Visit, Comet, SHyMet courses as well as NASA/SPoRT center R3 conducts science and outreach activities that are needed for users to fully exploit all GOES-R instruments and capabilities
Ops and Maintenance Activities Ops and Maintenance Assessments “O” Basic Research “R” R2O Activities R2O Assessments “R2O” R2O
Ops and Maintenance Activities Ops and Maintenance Assessments “O” Focused R&D Research Assessments “R2(R2O)” Ops and Maintenance Integration and Assessments “(R2O)2O” Basic Research “R” R2O Activities R2O Assessments “R2O” Breaking down R2O Components
Ops and Maintenance Activities Ops and Maintenance Assessments “O” Focused R&D Research Assessments “R2(R2O)” Ops and Maintenance Integration and Assessments “(R2O)2O” Basic Research “R” R2O Activities R2O Assessments “R2O” Scope of GOES-R Risk Reduction Breaking down R2O Components
FY11 proposals due Oct 1stwww.corpblogspot.org(click funding opportunities)
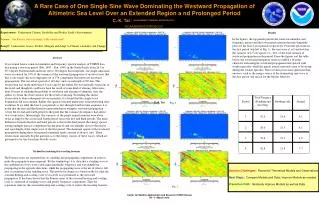
Combined Geo/Leo High Latitude Atmospheric Motion Vectors Geostationary satellites provide Atmospheric Motion Vectors (AMV) equatorward of ~60° latitude; polar satellites provide AMVs poleward of ~70° latitude. 50o 70o Developing novel ways to fill this gap is the next step in providing complete wind coverage for NWP applications. Data from a variety of satellites are blended and used for AMV generation. The images are composites of the Geo (GOES, Meteosat-7 and -9, FY-2C, MTSAT-1R, Kalpana-1) and Leo satellites (NOAA-15 through NOAA-19, Metop-A, NASA’s Terra and Aqua). Animation: Example of winds from composite GEO/LEO satellite data over Antarctica. Investigators: Matthew Lazzara – PI (SSEC), Dave Santek (CIMSS), Chris Velden (CIMSS), Jeff Key (STAR), Jaime Daniels (STAR) Slide courtesy of Matthew Lazzara/SSEC