Download
1 / 19
190 likes | 367 Views
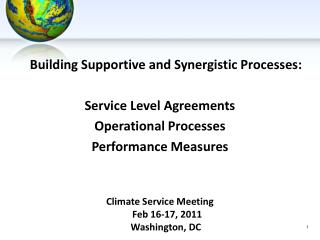
Building Supportive and Synergistic Processes: Service Level Agreements Operational Processes Performance Measures Climate Service Meeting Feb 16-17, 2011 Washington, DC. Acknowledgments: Thanks for great discussions so far with Rick Rosen Don Anderson Jin Huang Bill Lapenta

E N D
Building Supportive and Synergistic Processes: • Service Level Agreements • Operational Processes • Performance Measures • Climate Service Meeting Feb 16-17, 2011Washington, DC
Acknowledgments: • Thanks for great discussions so far with • Rick Rosen • Don Anderson • Jin Huang • Bill Lapenta • Scott Hausman • Mike Halpert • Scott Handel
Why do we need Service Level Agreements now? • To help build a roadmap for how we will work together. • To ensure accountability between the CS & other LOs on center / laboratory / office responsibilities translated into budget. • To assist planning (short and long term), redirection / integration, and execution. • Functional approach. February 16, 2011
Do we need SLA’s for each Climate Service Priority Area? • FY11 Priority Areas • Science • Predictions and Projections • Observations • Data • Monitoring • Science and Services • Partnerships • Regional • Communication • Assessments • Attribution • 11 Potential SLA’s? • How broad should the SLA’s be?
EXAMPLE: • Service Level Agreement Between the CS and the NWS for Predictions and Projections in Support of Regional Climate Services February 16, 2011
Background on the Agreement • Describes a working level relationship between the CS and the NWS for predictions and projections. • Focused on relationships between centers, laboratories and offices within the CS and NWS for this capability and thus does not address other capabilities, priority areas or programs within the individual lines that will not fall under this agreement. February 16, 2011
Outline of Agreement • Objectives • Background • Implementing Arrangement • Contributing Centers, Laboratories and Offices • Roles and Responsibilities • Annual Operating Plan • FY11 AOP Tasks and Milestones • Performance Measures • Issues • Memorandum of Agreement • Accountability; Signatures February 16, 2011
Objectives • To ensure an integrated end-to-end program inclusive of climate model development, execution, archive and delivery of climate predictions and projections on time and space scales relevant to decision makers. • To outline details of the relationship between CS and NWS centers, laboratories and offices contributing to the requirements of the CS and NWS for the predictions and projections capability. February 16, 2011
Tiers • 3 Tiers are envisioned • Memorandum of Agreement (MOA) signed at the AA level • Implementing Arrangement signed at the center / laboratory / office level • Annual Operating Plan (AOP) milestones and performance measures updated on an annual basis February 16, 2011
Background • CS and NWS will be key partners in NOAA’s program to respond to the NGSP objectives within the long-term climate adaptation and mitigation goal. • NOAA requires a prediction and projection capability for past, present and future states of the climate to support preparedness, adaptation and other climate-sensitive decisions. • NOAA capacity for predictions and projections is distributed among the NOAA line offices; is located in laboratories, centers, field offices, and programs; depends on strong and continuing internal and external partnerships; and requires formal agreements. February 16, 2011
Implementing Arrangement – • Participating Centers, Offices and Laboratories • National Weather Service • Environmental Modeling Center (EMC) • NCEP Central Operations (NCO) • Office of Hydrology (OHD) • Climate Services Division (CSD) • Climate Service • Climate Prediction Center (CPC) • Climate Test Bed (CTB) • National Climatic Data Center (NCDC) • Geophysical Fluid Dynamics Laboratory (GFDL) • Earth System Research Laboratory (ESRL) Physical Sciences Division (PSD) • Climate Program Office (NOAA Climate Predictions and Projections [NCPP] Platform, a partnership between the Research Programs Division (RPD) and the Climate Assessment and Services Division (CASD)) February 16, 2011
Implementing Arrangement – • Roles and Responsibilities • Details the actions planned and coordination between the CS and NWS centers, laboratories and offices contributing to the predictions and projections capability. • Example (next); there are many in the document February 16, 2011
Implementing Arrangement – • CFS Example NWS • Environmental Modeling Center (EMC) • Develop, implement and apply global models, including the CFS and GFS • NCEP Central Operations (NCO) • Provide IT infrastructure for operational forecasts (GFS, CFS); Provide reliable, timely and accurate central guidance to service centers, regions and local offices CS • National Climatic Data Center (NCDC) • Archive and provide public access to NOAA climate models and supporting datasets, including the NCEP CFS forecasts and CFS Reanalysis and Reforecasts • Climate Prediction Center (CPC) • Deliver operational climate prediction, monitoring and assessment products on timescales from weeks to years • Note: CPC will remain an affiliated NCEP Center February 16, 2011
FY11 Annual Operating Plan • Lists Tasks and AOP Milestones for each center • For FY11, this consists of the AOP milestones from our Seattle quad charts (all predictions and projections milestones are included) • See Document for details • For FY12 and beyond, a more cohesive set of Tasks and draft AOP Milestones would be developed starting with an annual planning meeting (e.g. during late summer, prior to the start of the new fiscal year). February 16, 2011
Performance Measures • Current measures are inadequate • Skill of US Seasonal Temperature Forecasts (GPRA) • Experimental decadal predictions under unforced conditions and under the action of climate forcings • Improved quantification of the regional distributions of atmospheric species of relevance for climate • Improved quantification of the roles of natural and anthropogenic factors in climate change • Increased contributions to national and international climate-relevant assessments • Cumulative Number of externally peer-reviewed publications from MAPP-funded projects • The Implementing Arrangement and annual AOP planning will enhance development of Logic Models for Performance Measurement and P&P Program Evaluation February 16, 2011
Issues • Issues to Discuss Feb 16-17: • A lot of effort is still needed in the “Implementing Arrangement” to focus roles and responsibilities on specific activities that integrate across the LO’s – and this relates to how we develop PMs and how broad the SLAs should be. • CTB will be broadened to help bring GFDL, NCEP and other models together to work on topical areas of mutual interest, e.g. by supporting CPTs. GFDL is participating in 3 CPTs jointly funded by NSF and NOAA and a CPPA funded VOCALS project. • GSD earth system model based on FIM not mentioned as a contribution to the CS in this SLA. Raises the question of whether anSLA can span more than 2 Los? • Missing from the document: • A section on financial considerations / funding strategy • A section describing how predictions and projections will develop its Annual Operating Plan in the future, including updates to this document: • Annual planning meeting (late summer) to draft AOP milestones February 16, 2011
What is an Operational Process • A process is considered operational (by CPC) if it satisfies one or more of the following: • Is required to update an existing climate prediction, monitoring or assessment product; • Is timely, reliable and accurate; • Produces output that is required as input into another operational process; • Produces output that is required by one or more internal or external users. February 16, 2011
CPC Performance Measures • Old • Skill of US seasonal temperature outlooks (GPRA) • A measure of Progress in seasonal forecasts • New (Proposed) • % of CPC forecasts above thresholds • Combines US extended range, monthly and seasonal temperature and precipitation outlooks • The trend shows Progress • The thresholds allow users to determine what fraction of CPC forecasts may be useful for their decisions. February 16, 2011
Climate Service Core Capabilities Address Societal Challenges