Download
1 / 15
150 likes | 276 Views
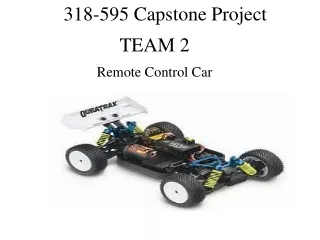
This comprehensive project outlines the teamwork and processes led by Katie Bealu and her team as they create a product using various engineering toolkits. The project covers essential phases, including technical foundation, prototype design, cost analysis, and quality systems. The team utilized PVC piping and steel to build two prototypes, experimenting with different materials and construction methods to optimize design and efficiency. Key focus areas include cost reduction, value analysis, and innovation, ensuring reliability and productivity in their final product.

E N D
Team 2 Katie Belau Drew Heller Curtis Bishop Alan Huffman Josh Deal Chris Kirkum Jared Elmiger Steven Miller Adam Fosnaugh Robert Ritzman David Hamilton James Rutti
Flow Chart Team Leader Katie Bealu Assistant Leader Adam Fosnaugh David Hamelton Sub Team 1 Chris Kirkum Sub Team 2 Steven Miller Curtis Bishop Jared Elmiger Alan Huffman Robert Ritzman James Rutti Drew Heller Joshua Deal
Applying Toolkit #1 • Technical Foundation For Industrial Technology, Technology Systems. • Discovering how to use the forms in the toolkits. • Familiarizing ourselves with the processes and each other’s knowledge. • Infrastructure • Getting used to the discussion boards and threading. • Passion For Quality and Productivity • Deciding a good design for our product that will have good merit. • Deciding which materials to use for each piece of our product. • Production • Using a Push Manufacturing technique to fill the orders. • Figure out the best way to produce our product. • Transportation • Use the University to get raw materials from the local Home Depot. • Communications • Electronic • Using the discussion board and chat to communicate ideas. • Written and Spoken • Meeting in class. • While building the product discuss different ways to become more efficient.
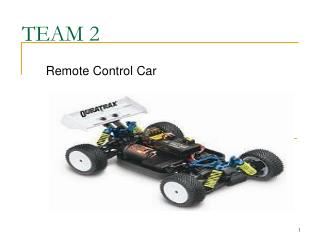
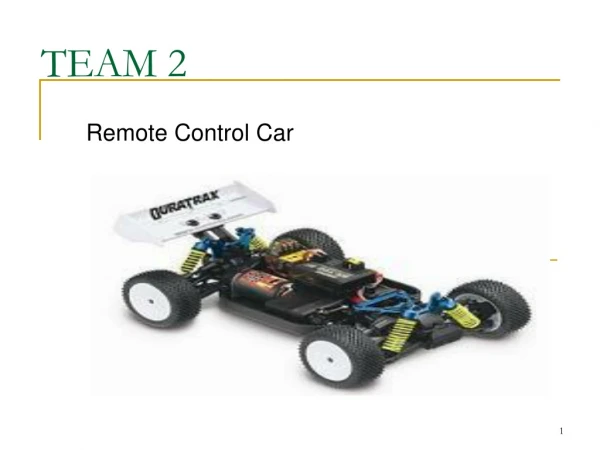
Applying Toolkit #2 • Our team decided to make two prototypes because one would be better than the other • To make out prototypes, we used PVC piping for the housing, and steel for our moving parts. • These materials seemed to be the best for our application of the product. • We used normal tools for the construction of our product. • Band saw, belt sander, miter saw, drill press. • Also, assorted hand tools along with glues and cleaners we used as fasteners. • The final product worked well, however… • We built and used out final working product • While we were constructing it, we made notes on things we are going to have to change for our absolute final product. • The cost of our product seems to be a little high. • We did not use our facility to its full capacity. • We tried to just get it built and not worry about long term construction.
Applying Toolkit #3 • Process and Application Engineering • We used this when we were all together using the machinery and seeing if our product will work and be sellable. • Design process • We used this to see if we had any problems with the product and see if we needed any improvements. • Material considerations • Our main considerations for materials were cost, effectiveness, and durability of the material we used. • Innovation • Our main change to our product is finding different materials that work the same as the original material, but cost less.
Toolkit #4 Summary • COST ANALYSIS, BROADER RELATIONSHIPS • - Why are we in business? Profit • - How do we enhance profits? • - Decrease costs, reduce waste, cut losses • - Increase sales, sales price, productivity • - Direct cost: material, labor, processing • - Indirect costs: sales, technical support • - Fixed costs: taxes, utilities, debt, staff • - Standard costs: time established, for bids • VALUE ADDED, VALUE ANALYSIS, DESIGN • -Cost value analysis relationships • *Can only Improve on what we understand • -Value analysis system • - Critique, brainstorm, questions • - Established functions/cost relationship • - Seek to understand effects of changes • - Minimize costs, maximize performance • - Reduce non-objective decisions • - Design and cost reduction, value adding opportunities • BEA, ROI, PLANNING, DECISION MAKING TOOLS • - Break Even Analysis: Profit and loss, sales income, other costs • Big picture as well as a specific circumstances • - Return On Investment: years, % payback annually • - Methods (examples) • - Manuel vs. Automated • - Direct and Indirect Labor • - Balance of load at work area • MRP, WIP, EAIZEN LEAN OPPORTUNITES • - Most understand, control inventory • - Schedule, routing, work area relationships • - MRP can help analyze parts needed • - Complex subassemblies
Applying Toolkit #4 • Cost Analysis, Broader Relationships • Have been drastically reducing prices • Quicker ways to make production flow better/faster • Fixing layout, better work environment • Value Added, Value Analysis, Design • More quality • More visually appealing • BEA, ROI, Planning Tools • Reported BEA ( attached ) • Reported ROI ( attached ) • Productivity, Quality Analysis, Six Sigma • Gathering information • Looking at competitors • Coming up with machines to do more then one task • Automated applied ( in mind ) • MRP, WIP, Kaizen, Lean Opportunities • Ordered parts for production • Knowing how much will be used • Knowing waste • Time required to finish assembly
Toolkit #5 Summary Introduction of quality systems Total Quality Movement. Quality Functions Deployment. • Quality Costs, Value Analysis. • Metrology and inspection • Metrology - The science of measurement based on some known standard. • Inspection- The comparison of existing materials or componentsto known standards or values. • Quality Characteristics- important dimensions, features or parts. • Traditional Versus New Approaches- Traditional functions revolve around providing sufficient inspection standards and procedures determined over time. • Vendor Certification- an attempt to determine the quality of a vendor and to certify that what was specified is actually provided. • Metrology And Inspection Systems In Quality- principles include basic measures and standards, precision and accuracy, calibration, • length, time, mass, temperature, electric current, and light. • Specific Inspection Procedures- essential to providing optimum quality and they • typically rely on general information. • Statistics in quality • Essential to providing optimum quality. • Typically relies on general information. • Data-based systems • Attribute Charting Systems- provides a good general basis from which to initiate and pursue attribute charting. • The P Chart Steps For Constructing Attribute Data- • Attribute Step 1: Collect Data. • Attribute Step 2: Collect/Calculate Each Fraction Defective. • Attribute Step 3: Calculate Average Fraction Defective. • Attribute Step 4: Computing The Control Limits And Central Line Values • Attribute Step 5: Plotting The Points. • Attribute Step 6: Analysis Of The Chart. • Summarize decisions and issues • Attributes, Checklists And Charting of problems and defects. • SPC, X-bar And R, Variable Charting-describes a simple but effective charting technique used for statistical process control. • Problem solving documentation • Define customers, suppliers of products, document the process, Drive stakes to gage improvement, Make the improvement happen, Carefully document, and evaluate. • 8-D systems • Process which uses several questions, or categories of response/reaction information to inform everyone of the action being taken to address the process. • Reliability • Usually associated with how the product will perform over time, including at some future time. • Synchronized Kaizen opportunities • Opportunities exist for process and product improvement through material and process focused study and applied research.
Applying Toolkit #5 • Quality Functions Development • Metrology and Inspection • The science of measurement applied is that we knew the standard in our working conditions: material, space, and time left to complete each task. • We compared each existing material/time limit/space and made everything in accordance to what we knew according to our standards and procedures. • Statistics in Quality • Showing in production if we would be hitting the mean of each product and hoping that production works symmetrically as according to the empirical chart. • Problem Solving documentation • We analyzed that our product would appeal more to college students, so we defined our customers in that term. Our supplier of products through out the entire project as been Home Depot, and through SDA’s we have been calculating time and money used for every procedure.
Toolkit #6 Summary • * Automation and computer integration • * Computers and automation have become an everyday use in this day of age. • * Computers and automation are endless with all the variety of applications. • * Devices used to complete specific tasks in a technology environment is automation. • * CAD-CAM systems • *Computer Aided Design (CAD) is an application that allows users to graphically develop geometric • models that describe the size and shape of the components of the model. • *Computer Aided Production (CAP) also referred to as CAM, is using the computer to control various • factors linked to the processing components. • * Computer analysis and control • * When specific things are aided by the computer and kept up-to-date by the computer. • * The computer keeps track of hundreds and thousands of complicated data topics and kept without • being lost. • * Networks, artificial intelligence, and beyond • * Computer communication is done by using computer software; networking allows computer • communication to occur. • * Massive amounts of date stored in a computer causing communication between non-human machines is artificial intelligence. • * The internet is also a major network that allows communication between people to people and • companies to companies. The internet is endless of things to do and ways to communicate. • * Final points on toolkit 6 • * This tool discusses the key to good productivity and quality enhancements. Computers are the future • of design, manufacturing, and company communication.
Applying Toolkit #6 * CAD was used to make a 3-D model of our product, “the gunner”. * By using this, it gave us an excellent visual to base our product look and size. * Computer networking was used all throughout the course, by the electronic chat room and the threading of messages and SDA’s/RCA’s. * The internet was used by allowing us to use the electronic chat room and threading. Also, finding valuable sites for the IRBCA was done through the internet. Without the internet, this course would be totally different. * We used automation with our PVC pipe cutting to increase the ROI, which made our production quicker and easier. * The computer was used to keep track of our SDA’s, RCA’s, power points, and threads.
This jig will help the station worker. The jig will be bolted to the table so it won’t move. The jig will help the worker cut the pieces faster because they won’t have to measure any. They will slide the PVC pipe until it makes contact with the jig then cut the piece. The pieces will all be closer to the same length than if the worker had to measure each piece and line them up with the blade. The jig will help quality for the Gunner. - The quality will be better because the pieces will be closer to the same length. This will make sure that none of the pieces are too short to hold the pop can. The jig will give us an ROI. - The jig will give us an ROI because it is saving us quality costs. Because of the jig we may not have to have someone check the part. This person can now do other things instead. The jig will also cause fewer pieces to need to be thrown away because of being too short. Automation
Due to mass production it took us an average of just under 9min per gunner, while when we just built one it took us about 40min.