Download

1 / 17
170 likes | 273 Views
Explore lexical networks and Infovis benchmarks, optimize layouts for graph comparison, and reify matching functions with the Donatien system. Enhance interaction and layouts for future improvements.

E N D
Interactive matching and visual comparison of graphs MountazHascoët, mountaz@lirmm.fr, LIRMM, CNRS, Univ. Montpellier Pierre Dragicevic, dragice@lri.fr, INRIA, Univ. Paris-Sud Problem Approach Results
Lexical network Lexical network for French • « Jeux de mots » • 200 000 Frenchterms 1 200 000 lexical relations ~30 types of relations (hyponymy, hyperonymy, meronymy, associatedideas, etc) ~3 versions of the network eachyear http://www.jeuxdemots.org/ =>Tools to analyze the quality of the network are needed
Graph comparison, what for? • Are twosubgraphsdifferent? • Are subgraphs for different relations consistent? • Which graph has lowererror rate?
Infovis benchmark • The Infovis 2004 benchmark contains • Metadata for 614 papers • Publishedbetween 1974 and 2004 • Extraction of TopicMaps • Topicsfromtitle and keyword lists • One topicmap per each
Graph comparison, what for? • Do severaltopicmapsdiffersignificantly? • How topicsevolve over time • Appear/disappear/refine • How does the connectivityevolve over time?
Approach • Optimisation • Use optimizedlayoutfrompreviouswork • Visualization • Introducepresentationstrategiessuitable for graph comparison • Interaction • Leave important matchingchoices to end-users
Results • Proposal • Multi-layer model • Animated reconfigurations • Reification of matchingfunctions • Proof of concept • A system named Donatien • Two case studies with real data
1. Multiple layers • Direct Manipulation on layers • Side-by-side arrangement • Superposed • Crossing
2. Animated reconfiguration • Optimizedlayout • Optimisation of aestheticcriteria • Property • Enhancedlegibility of graphs • Limits • If two graphs are the exact same graph • No guaranteethatlayout are the same • Optimizedlayouts • Invariant layout • Deterministlayout • Based on node signatures • Property • 2 identical graphs have the samelayout • Warning: reciprocally not true • Limits • Legibility of graphs
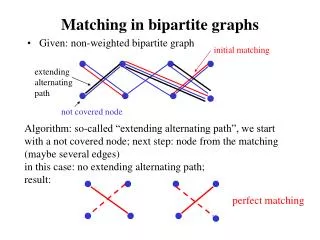
Comparisonwithmatching • Requirements • Computematchingnodes • Interactivelyadjustthismatching • Superimposematchingnodes • Solution • Create a master graph • From invariant layout • To embody the matchingfunction in a layer • Integratedsmoothlywithotherlayers
3. ReifyingMatchingFunction • Notations • G1(V1,E1), G2(V2,E2)… Gn(Vn,En) • graphs to becompared • M : A matchingfunction • A hypergraph H(V1uV2u…Vn,EM) • Master Graph • Embodies the MatchingFunction • G(V,E) is a graph • V represents hyper-edges of H • n V, (v1,v2,…vk) EM • n -> (v1,v2,…vk) • E representsedges of E1, E2, … En
Conclusion • Visual comparison of graphs • Invariant lMulti-layer model • Animated reconfiguration • ReifiesMatchingFunction • Layout and superposition • Smoothintegration of master graph • Future work • Enhance interaction model • Enhance invariant layouts
Thanks for your attention demoat lunch Questions ?