
Chapter 13: Correlation
E N D
Presentation Transcript
Chapter 13:Correlation An Introduction to Statistical Problem Solving in Geography As Reviewed by: Michelle Guzdek GEOG 3000 Prof. Sutton 2/27/2010
Learning Objectives • The Nature of Correlation • Association of Interval/Ratio Variables • Association of Ordinal Variables • Use of Correlation Indices in Map Comparison • Issues Regarding Correlation
Introduction • One of the more important concerns in geographic analysis is the study of the relationships between spatial variables • Many geographic studies involve determining the degree of relationship between two or more map patterns • Using visual comparison to measure correspondence or association is subjective • Two people can view the same maps and interpret their association very differently
Introduction (cont.) • Focus of geographic inquiry is often to establish the spatial association between two variables • Correlation analysis provides a more objective, quantitative means to measure the association between a pair of spatial variables • Both direction and strength of association between two variables can be determined statistically
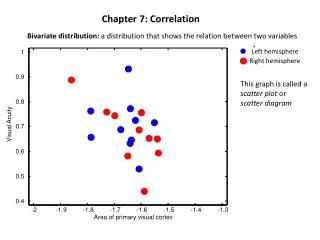
Nature of Correlation • Common tool for portraying the relationship or association between two variables is a two-dimensional graph called a scattergram, or scatterplot • One variable plotted on each axis • Provides an understanding of the nature of a particular relationship • Can determine direction (positive or negative) and strength of association • Any two variables can be correlated and the strength and direction of relationship calculated • IMPORTANT NOTE: A relationship or association between variables does not necessarily imply the existence of a cause and effect relationship
Scattergram or Scatterplot • Three examples of scattergrams Neutral/
Association of Interval/Ration Variables • Statisticians have defined various indices, called “correlation coefficients,” to measure the strength of relationships • Minimum value of -1 • Maximum value of +1 • Value of 0 denotes no correlation or association between variables
Pearson’s correlation coefficient (r) • Most powerful and widely used index to measure the association or correlation between two variables is the Pearson’s product-moment correlation coefficient • To use this measure of association data must be of interval or ratio scale • Assumed variables have a linear relationship • Relates closely to the statistical concept of covariation • The degree to which two variables vary together or jointly
Correlation Coefficient Examples Image Source: http://en.wikipedia.org/wiki/Pearson_product-moment_correlation_coefficient
Pearson’s… (cont.) • Can be expresses mathematically in several different ways: • With deviations from the mean and standard deviations • With X and Y values transformed to Z-scores • With the original values of X and Y variables
Pearson’s Scattergram Image Source: http://userpages.umbc.edu/~nmiller/POLI300/%2311.SCATTERGRAMS.pdf
Geographic Example Image Source: http://www.uv.es/elopez/?21
Association of Ordinal Variables • In geographic problems with data in ranked form, Spearman’s rank correlation coefficient (rs) is the most widely used measure of strength of association between variables • Statistical power of Spearman’s correlation has been shown to be nearly as strong as Pearson’s r • Appropriate when: • Variables are measured on an ordinal (ranked) scale • Interval/ratio data are converted to ranks
Spearman’s correlation index • May be appropriate when if samples are drawn from highly skewed or severly nonnormal populations • Applicable is situations where X and Y variables have a monotonic relationship • Spearman’s rank correlation coefficient does not distinguish between a linear relationship and a monotonic one • Values are the same as Pearson’s
Geographic Example Image Source: http://www.nhm.ac.uk/research-curation/research/projects/worldmap/diversity/c2.htm
Use of Correlation Indices in Map Comparison • How can a geographer measure the association between two map patterns when the original data are not readily available? • With the use of spatial sampling methods, correlation indices can be applied to numerical data acquired from maps • Three type of maps: • Dot maps, isoline maps, and choropleth maps
Dot Maps • A set of equal size quadrants are placed over the maps • If the scale is not the same, the quadrant size can be adjusted for the second map • Each quadrant represents an observation and the the frequency of points per quadrant from the two maps are the X and Y values • Using the data set created from the dot map, either Pearson or Spearman correlation indices can be calculated
Isoline Maps • Method is analogous to that used for dot maps, however instead of placing quadrants over the maps a set of sample points are placed systematically on each isoline map • The value of the continuously distributed variable is recorded for each matching pair of points • The recorded values from the two isoline maps provide the corresponding matched X and Y values • A correlation coefficient is calculated that measures the strength of association between the two map variables
Choropleth Maps • Measure the degree of association between two choropleth maps having the same internal subarea boundaries • Maps may show Classified data into a set of ordinal categories • Assign numerical values to each category suitable for correlation analysis • For this problem type, Spearman’s correlation index is a better choice than Pearson’s to show the generalized association between the two variables
Issues Regarding Correlation • When geographers apply statistical analysis to spatial data, the level of aggregation of the observation units may influence the results • Concern is especially important when inferences are drawn from the results of geographic analyses • Significant findings at one level of aggregation may not occur at other levels • Example: level of income and amount of education may be highly correlated for individuals, but may not be at county or state levels
Ecological Fallacy • Another critical geographic concern is the so called ecological fallacy concept • Reversal of the problem of aggregation described in the previous slide • Researchers sometimes use highly aggregated data and attempt to infer these results to lower levels of aggregation or to the individual level • Example: Just because crime rates are statistically correlated with percentage of persons under the poverty level at the state or census tract level, it does not imply that all persons under that poverty level are criminals
References • I was hardpressed to find some good web examples for correlation! • McDonald, J.H. 2009. Handbook of Biological Statistics (2nd ed.). Sparky House Publishing, Baltimore,Maryland. pp. 221-223 http://udel.edu/~mcdonald/statspearman.html • Statistics Canada 2010. Scatterplots. http://www.statcan.gc.ca/edu/power-pouvoir/ch9/scatter-nuages/5214827-eng.htm • Wikipedia 2010. Pearson Product-Moment Correlation Coefficient.http://en.wikipedia.org/wiki/Pearson%27s_r