Chapter 12 Correlation and Regression
270 likes | 412 Views
Part III: Additional Hypothesis Tests. Chapter 12 Correlation and Regression. Renee R. Ha, Ph.D. James C. Ha, Ph.D. Integrative Statistics for the Social & Behavioral Sciences. Figure 12.1. Relationship Between Effort and Grade Point Average. Table 12.1. Raw Data. Figure 12.2.

Chapter 12 Correlation and Regression
E N D
Presentation Transcript
Part III: Additional Hypothesis Tests Chapter 12 Correlation and Regression Renee R. Ha, Ph.D. James C. Ha, Ph.D Integrative Statistics for the Social & Behavioral Sciences
Figure 12.1 Relationship Between Effort and Grade Point Average
Table 12.1 • Raw Data
Figure 12.2 • Relationship between effort and grade point average
Definitions • Positive (direct) relationships: As X increases, Y increases. • Negative (inverse) relationships: As X increases, Y decreases. • Perfect relationships: All data points fall on the best-fit line. • Imperfect relationships: All data points do not fall on the best-fit line.
Figure 12.3 • Types of Linear Relationships
Correlation • A correlation coefficient is a statistic that expresses the degree of the fit of the data to a line and the type of relationship (direct or inverse).
Correlation • Correlation coefficients make no assumptions about the cause-and-effect direction of an X-Y relationship but rather simply measure the degree to which two sets of paired scores vary together in a consistent (linear) manner.
Characteristics of Correlation Coefficients 1. Values always range between –1 and +1. 2. A positive coefficient indicates a direct relationship (positive slope), whereas a negative coefficient (negative slope) indicates an inverse relationship.
Characteristics of Correlation Coefficients 3. A coefficient of zero indicates that there is no relationship between the two variables. 4. A coefficient that is equal to –1.00 or +1.00 indicates that you have a perfect relationship between your variables.
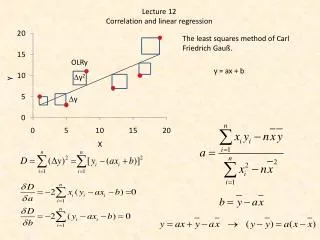
Pearson’s r Formula r = R2 = The proportion of the variability in Y that is explained by X.
Results when you use Microsoft Excel to calculate a Correlation
Results when you use SPSS to calculate a Correlation ** Correlation is significant at the 0.01 level (2-tailed).
When is it appropriate to use Correlation? 1. You have two variables on an interval or ratio (continuous) scale. 2. The relationship between the two variables is linear (rather than curvilinear, or not fitting a straight line). 3. You wish to describe the strength of the relationship between your two variables.
Linear Regression • Linear regression is a technique that is closely related to correlation. • In regression, we generally assume that the X variable is the predictor variable (number of hours of study effort, in our example) and the Y variable is the criterion variable (GPA).
Linear Regression • Y-intercept: The value of Y when X is equal to zero, which is where the line crosses the Y-axis. • Slope: The change in Y divided by the change in X.
Figure 12.4 • Relationship Between Effort and Grade Point Average
Results if you use Microsoft Excel to calculate a regression on study time-GPA data
Results if you use SPSS to calculate the regression Model Summary a Predictors: (Constant), HOURS ANOVA a Predictors: (Constant), HOURS b Dependent Variable: GPA Coefficients a Dependent Variable: GPA
Standard Error of the Estimate (SEE) • This is the amount of error around the estimate (the regression line), just like the standard deviation measures error around the mean.
When is it appropriate to use Regression? 1. When you have a predictor and a criterion variable on an interval or ratio scale. 2. When the relationship between the two variables is linear. 3. When your data are homoscedastic. This means that the variability around the regression line is uniform for all of the values of X.
Figure 12.5 • Example of Data That are Homoscedastic and Non-Homoscedastic
Multiple Regression • Multiple regression is like the two-way ANOVA because it has more than one predictor variable effect that is assessed at the same time.