Download
1 / 31
320 likes | 500 Views
MENA Water Outlook 2050. Water Scarcity and Adaptation Options Peter Droogers, Walter Immerzeel , Petra Hellegers Jippe Hoogeveen, Bekele Debele Negewo. Study Design. Objectives Detailed water supply and demand analysis 2010-2050

E N D
MENA Water Outlook 2050 Water Scarcity and Adaptation Options Peter Droogers, Walter Immerzeel, Petra Hellegers Jippe Hoogeveen, BekeleDebeleNegewo
Study Design • Objectives • Detailed water supply and demand analysis 2010-2050 • Identification of potential options to overcome water shortage • Steps • Climate and other change projections • Hydrological impact model • Water resources supply/demand analysis • Cost and benefits adaptation options • Limitations • Large scale so simplifications, generalizations
WEAP Modeling Framework • WEAP modeling setup • 22 countries • Streams, Reservoirs, Groundwater • Irrigation, Domestic, Industry • 2000-2050 • 3 climate change models • Resultsfromhydrological model
Results 2000 2010 2020 2030 2040 2050 Demand curves MENA (AVG)
Results Demand curves MENA (DRY) 2000 2010 2020 2030 2040 2050 2000 2010 2020 2030 2040 2050 Demand curves MENA (WET)
Results Demand and Supply Curves MENA (AVG)
Results Demand and Supply Curves MENA (DRY) Demand and Supply Curves MENA (WET)
Egypt Iran Morocco Yemen
Water Demand-Shortage MCM/year; averageclimate change
Water MarginalCost Curves • Closingsupply-demand gap: • Increasing the productivity • Expandingsupply • Reducingdemand • Water marginalcosts curves • Assumptions: • Net present value (US$ 2010)
Strategies • Increasing the productivity: • A: Improved agricultural practice (including crop varieties) • B: Increased reuse of water from domestic and industry • C: Increased reuse of irrigated agriculture • Expanding supply: • D: Expanding reservoir capacity (small scale) • E: Expanding reservoir capacity (large scale) • F: Desalination by means of using solar energy • G: Desalination by means of reverse osmosis • Reducing demand: • H: Reduce irrigated areas • I: Reduce domestic and industrial supply
Strategies (increase productivity) • A: Improved agricultural practice (including crop varieties) • Typical examples: • drip and sprinkler irrigation • no-till farming • improved drainage • utilization of the best available germplasm or other seed development • optimizing fertilizer use • innovative crop protection technologies • extension services • Costs • US$ 0.01 per m3 • = US$ 100 per ha per year • Note: costs can vary substantially. E.g.: • Egypts IrrigationImprovement Project (IIP) US$ 100 per ha per year • 2030 Water Resources Group US$ 0.02 – 0.03 per m3
Strategies (increase productivity) • B: Increased reuse of water from domestic and industry • Costs • US$ 0.30 per m3 • Note: costs can vary substantially. • What to do with reused water (industry, irrigation)
Strategies (increase productivity) • C: Increased reuse of irrigated agriculture • Assumptions • Reuse only for agriculture • No water treatment system • Only operational and investment costs • 50 mm per year • Costs • Total: US$ 0.04 per m3 • 50% annualized capital costs of investment • 50% operational costs (maintenance, some pumping)
Strategies (expanding supply) • D: Expanding reservoir capacity (small scale) • E: Expanding reservoir capacity (large scale) • Costs • 0.03 $/m3 for small scale • 0.05 $/ m3 for large scale • Note: costs can vary substantially • sand dams in Kitui District, Kenya 0.04 $/m3 • Aslantis Dam, Turkey 0.035 $/m3
Strategies (expanding supply) • F: Desalinisation using solar energy (CSP) • G: Desalination using reverse osmosis • Costs • CSP 0.70 $/m3 to 0.35 $/m3 in 2030 and 2050 • Reverse osmosis 0.50 $/m3 • Note: costs can vary substantially • Especially energy Reverse Osmoses Multi Effect Distillation
Strategies (reducing demand) • H: Reduce irrigated areas • Assumptions • Reduce irrigated areas by 10% • Costs • 0.10 $/m3 (Value of irrigation water (Water Productivity) between 0.05 and 0.15 $/m3. • Note: costs can vary substantially. E.g.: • Crops • Irrigationmethod • Climate
Water Supply andDemand MENA region
MENA: Water MarginalCosts Curves Allvalues in 2010 US$ net present value
Egypt SaudiArabia
Conclusions • Study • Advanced hydrological-water resources approach • In country variability • Monthly approach • Changes: climate, GDP, domestic, industry, agriculture • Scopingstudy • Overall results • Renewable water resources 20% reduction • Water shoratge 220 km3 (range 104-306) • Water shortage due to climate change 14% (range 1-35) • Costs of adaptation US$ 47 billion (range 12-98) • Costs of adaptation 2050: 2.5% to 0.3% of GDP (current to 2050 GDP) • Adaptation is possible, ifpolicies are put in placenow!
ComparisonOther Studies • “Economics of adaptation to climate change” (World Bank, 2010): • Developingcountries: 0.2 percent GDP (2030) • Developingcountries: 0.12 percent GDP (2050) • MENA: US$ 2.5 – 3.6 billion per year (2050) • “2030 Water Resources Group” • MENA: increase in demand: 99 km3 (2030) • Making the Most of Scarcity (World Bank, 2007): • MENA: 1 – 3.6% of GDP (currently) • AQAU-CSP (DLR) • Water shortage: 50 km3 (current) • Water shortage: 150 km3 (2050) 2050: Shortage (km3): 220 (104-306) Costs (billion US$): 47 (12-98) GDP (%): 0.3 – 2.5
Way Forward • Water shortage: • Unconventional decisions needed • Food, environment, tourism, industry? • Subsidies on water-food-energy • Water-energy nexus • Long and short term decisions • Detailed case studies (country, topic)
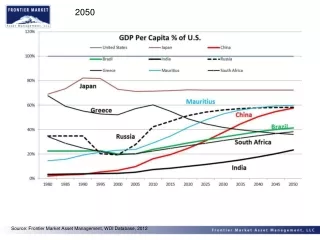
GDP projections Morocco Egypt