Download

1 / 22
220 likes | 367 Views
Chapter 7 Demand and Supply. The Marketplace. Consumers influence the price of goods in a market economy Demand is how people decide what to buy and at what price Supply is how sellers decide how much to sell and what to charge A market represents actions between buyers and sellers.

E N D
The Marketplace • Consumers influence the price of goods in a market economy • Demand is how people decide what to buy and at what price • Supply is how sellers decide how much to sell and what to charge • A market represents actions between buyers and sellers
DEMAND • Market economy – people act in their own best interests to answer What, How, Form whom • Demand is created only when the customer is both willing and able to buy a product • Quantity demanded is the amount (quantity) of an item that consumers are willing and able to buy at a certain price
DEMAND • Before you can start a business, you have to know what the DEMAND is for your product! • If you open a pizza place, and there are 3 other pizza places in the neighborhood, the demand is different than if you’re the only one!!
The Law of Demand • As price goes up, quantity demanded goes down • As price goes down, quantity demanded goes up • INVERSE RELATIONSHIP
The Law of Demand • Quantity demanded and price move in opposite directions (inverse relationship) $ $ Q Q
Discussion Question • How does the seesaw illustrate the relationship between price and quantity demanded? Price Quantity
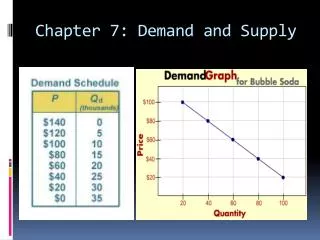
DEMAND SCHEDULE The numbers in the demand schedule to the right show that as the price per CD decreases, the quantity demanded increases. Note that at $16 each, a quantity of 500 million CDs will be demanded.
Graphing the Demand Curve Part BPlotting the Price– Quantity Pairs Note how the price and quantity demanded numbers in the demand schedule have been transferred to the graph on the right. Find letter E. Note that it represents a number of CDs demanded (500 million) at a specific price ($16).
Graphing the Demand Curve Part CDemand Curve for CDs The points in the previous graph have been connected with a line in the chart to the right. This line is the demand curve, which always falls from left to right. How many CDs will be demanded at a price of $12 each?
DETERMINANTS OF DEMAND # 1 = PRICE • This will effect the QUANTITY DEMANDED: • Two Effects: A. Income Effect When people are limited by their income as to what they can purchase. If the price rises and their income stays the same, they cannot buy the same quantity of a product. Ex: When gas prices rise and your income does not. What happens when the price of gas goes down and your income remains the same?
DETERMINANTS OF DEMAND B. Substitution Effect When people can replace one product with another if it satisfies the same need. Ex: buying a CD instead of buying concert tickets
DID YOU KNOW? • Drugs needed to get and stay well can take a BIG part of one’s income - especially if that income is fixed. • Use of generic drugs give us cheaper alternatives to brand name drugs - once the patent is up, other companies can make that same drug cheaper.
Law of Demand 3. Diminishing Marginal Utility • Marginal utility • The satisfaction you get from having one more unit of a product • Diminishing Marginal Utility • Falloff of satisfaction with each additional unit you buy • Ex: brownies
Practice • Write an example from personal experience of how price, real income, or the substitution effect changed your decision to buy a good or service.
Practice • Describe an instance in your own life when diminishing marginal utility caused you to decrease the quantity you demanded of a product or service • Imagine you sell popcorn at the local football stadium. How would diminishing marginal utility effect the prices of your popcorn after half-time?
DETERMINANTS OF DEMAND • The other Determinants effect a Demand change – price stays the same, but people willing to buy different amounts of the product
DETERMINANTS OF DEMAND • Consumer income (rise in income, more $ to spend = greater demand; lower income, less $ to spend = less demand) • Consumer tastes • Related Products A. Substitutes B. Complements • Future Expectations (expected income of buyer, expected price, expected new technology) • Population (the total # of buyers in the market) – this is for the total market demand
Determinants of Demand Income Part BChange in Demand if Your Income Decreases • The demand curve D1 represents CD demand before income decreased. The demand curve D2 represents CD demand after income decreased. If your income goes up, however, you may buy more CDs at all possible prices, which would shift the demand curve to the right.
Determinants of Demand Part CChange in Demand if an Item Becomes a Fad Fad • When a product becomes a fad, more of it is demanded at all prices, and the entire demand curve shifts to the right. Notice how D1–representing demand for Beanie Babies™ before they became popular–becomes D2– demand after they became a fad.
DEMAND CHEAT SHEET! • Demand is about the CONSUMER • INVERSE RELATIONSHIP BETWEEN PRICE AND QUANTITY DEMANDED As price goes down, quantity demanded goes up As price goes up, quantity demanded goes down • Determinants shift the demand curve • If we have more money to spend, our demand is higher • If a product is the hottest style/trend, our demand is higher • If a substitute is available, demand is lower for the original product; higher for the substitute Turn to pg. 175 and complete #1-3