Download
1 / 42
440 likes | 493 Views
Chapter 3 Supply and Demand. Chapter Outline. Market demand Market supply Market equilibrium Comparative statics analysis Supply, demand, and price. Learning Objectives. Define supply, demand, and equilibrium price

E N D
Chapter Outline • Market demand • Market supply • Market equilibrium • Comparative statics analysis • Supply, demand, and price
Learning Objectives • Define supply, demand, and equilibrium price • List and provide specific examples of the non-price determinants of supply and demand • Distinguish between the short-run rationing function and long-run guiding function of price • Illustrate how the concepts of supply and demand can be used in management decisions about price and allocations of resources. • Use supply and demand diagrams to determine price in the short and long run
Market Demand • The demand for a good or service is defined as: • Quantities of a good or service that people are ready, willing and able to buy at various prices within some given time period. (Other factors besides price held constant.)
Market Demand • “Ready” implies that consumers are prepared to buy a good or service both because they are: • Willing: Consumers have a preference for it. • Able: Consumers have the income to support this preference.
Market Demand Market demand is the sum of all the individual demands. • Individuals may have distinct demand curves, and they sum to the overall demand in the market. Example: demand for pizza
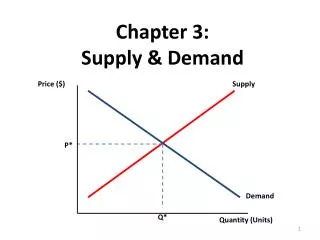
Market Demand There is an inverse relationship between price and the quantity demanded of a good or service. This is called the Law of Demand. Thus, the demand curve is downward sloping.
Market Demand • Graphical Representation of Demand • Algebraic Representation of Demand Qd=700-100P
Market Demand • Changes in price result in changes in the quantity demanded • This is shown as movement along the demand curve. • Changes in non-price factors result in changes in demand • This is shown as a shift in the demand curve.
Market Demand • Non-price determinants of demand-result is a shift in the demand curve. • tastes and preferences • income • prices of related products • future expectations • number of buyers
Market Supply • The supply of a good or service is defined as quantities that people are ready to sell at various prices within some given time period (Other factors besides price held constant)
Market Supply • Changes in price result in changes in the quantity supplied • shown as movement along the supply curve • Changes in non-price determinants result in changes in supply • shown as a shift in the supply curve
Market Supply • Non-price determinants of supply-results in a shift in the supply curve. • costs and technology • prices of other goods or services offered by the seller • future expectations • number of sellers • weather conditions
Market Equilibrium • Equilibrium price: the price that equates the quantity demanded with the quantity supplied • Equilibrium quantity: the amount that people are willing to buy and sellers are willing to offer at the equilibrium price level
Market Equilibrium • Shortage: a market situation in which the quantity demanded exceeds the quantity supplied • shortage occurs at a price below the equilibrium level • Surplus: a market situation in which the quantity supplied exceeds the quantity demanded • surplus occurs at a price above the equilibrium level
Comparative Statics Analysis • Comparative statics is a form of sensitivity (or what-if) analysis • Commonly used method in economic analysis
Comparative Statics Analysis • Process of comparative statics analysis: • state all the assumptions needed to construct the model • begin by assuming that the model is in equilibrium • introduce a change in the model, so a condition of disequilibrium is created • find the new point of equilibrium • compare the new equilibrium point with the original one
Comparative Statics Analysis Step 1 • assume all factors except the price of pizza are constant • buyers’ demand and sellers’ supply are represented by lines shown
Comparative Statics Analysis Step 2 • begin the analysis in equilibrium as shown by Q1 and P1
Comparative Statics Analysis Step 3 • assume that a new study shows pizza to be the most nutritious of all fast foods • consumers increase their demand for pizza as a result
Comparative Statics Analysis Step 4 • the shift in demand results in a new equilibrium price (P2) • and a new equilibrium quantity (Q2)
Comparative Statics Analysis Step 5 • comparing the new equilibrium point with the original one, we see that both equilibrium price and quantity have increased
Comparative Statics Analysis • The short run is the period of time in which: • sellers already in the market respond to a change in equilibrium price by adjusting variable inputs • buyers already in the market respond to changes in equilibrium price by adjusting the quantity demanded for the good or service
Comparative Statics Analysis • Short run changes show the rationing function of price • The rationing function of price is the change in market price to eliminate the imbalance between quantities supplied and demanded.
Comparative Static Analysis:Short-run • an increase in demand causes equilibrium price and quantity to rise
Comparative Static Analysis: Short-run • a decrease in demand causes equilibrium price and quantity to fall
Comparative Static Analysis: Short-run • an increase in supply causes equilibrium price to fall and equilibrium quantity to rise
Comparative Static Analysis: Short-run • a decrease in supply causes equilibrium price to rise and equilibrium quantity to fall
Comparative Static Analysis:Long-run • The long run is the period of time in which: • new sellers may enter a market • existing sellers may exit from a market • existing sellers may adjust fixed factors of production • buyers may react to a change in equilibrium price by changing their tastes and preferences
Comparative Static Analysis:Long-run • Long run changes show the allocating function of price • The guiding or allocating function of price is the movement of resources into or out of markets in response to a change in the equilibrium price.
Comparative Static Analysis:Long-run • initial change: decrease in demand from D1 to D2 • result: reduction in equilibrium price and quantity (to P2, Q2) • follow-on adjustment: • movement of resources out of the market • leftward shift in the supply curve to S2 • equilibrium price and quantity (to P3, Q3)
initial change: increase in demand from D1 to D2 result: increase in equilibrium price and quantity (to P2, Q2) follow-on adjustment: movement of resources into the market rightward shift in the supply curve to S2 equilibrium price and quantity (to P3, Q3) Long-run Analysis
Supply, Demand, and Price • In the extreme case, the forces of supply and demand are the sole determinants of the market price, not any single firm. • this type of market is ‘perfect competition’ • In many cases, individual firms can exert market power over price because of their: • dominant size • ability to differentiate their product through advertising, brand name, features, or services
Supply, Demand, and Price • Discussion of changes in the computer industry • Makers of PCs, notebooks and jump drives are facing slower growth in the demand for their products as technology is changing. • What impact do you think cloud computing will have on the demand for stand-alone applications such as Microsoft Office or storage devices for computers?
Global Application What are the implications of rising demand for oil among developing counties?
Summary • The law of demand states that, other factors held constant, the quantity demanded is inversely related to price. • The law of supply states that, other factors held constant, the quantity supplied is directly related to price. • Non-price factors may shift the curves. • Price serves a short-run rationing function and a long-run guiding function in the marketplace.