Download
1 / 1
10 likes | 126 Views
This research presents a novel method for producing microsphere-based drug delivery systems that enable controlled and extended release of medications. By utilizing a computer simulation, doctors can specify a target blood plasma drug concentration and accurately calculate the optimal dosage of microspheres needed for each patient. The study emphasizes the significance of long-acting drug injections, such as those for Haloperidol and Naltrexone, and details the economic feasibility of microsphere production for pharmaceutical applications. Such technology holds great promise for revolutionizing patient treatment.

E N D
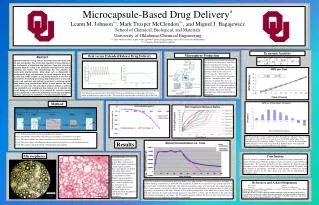
Microcapsule-Based Drug Delivery* Leann M. Johnson**, Mark Trosper McClendon**, and Miguel J. Bagajewicz School of Chemical, Biological, and Materials University of Oklahoma-Chemical Engineering (*) This work was done as part of the capstone Chemical Engineering class at the University of Oklahoma (**) Capstone Undergraduate students Economic Analysis Method Microsphere Production Oral versus Extended Release Drug Delivery • A schematic of microsphere production1. This process has three major steps. First, there is emulsification (stirring) of a solution containing polymer, drug, and a small amount of stabilizer. For PLGA polymers, ethyl acetate is used as a solvent and poly (vinyl alcohol) is a stabilizer. Next, the solvent is extracted from the “continuous phase” and allowed to evaporate. This leaves the polymer-rich phase droplets that begin to harden. Finally, the harden microspheres are then filtered, washed and lyophilised (freeze dried). This leaves only the desired polymer with encapsulated drug throughout. Abstract Significant advances in drug delivery technology have been made over the past two decades. One of the most important of these advances is the development of long acting drug injections. These long acting drug injections allow for a drug to be continually released for time periods exceeding one month. This biotechnology has the potential to revolutionize pharmaceuticals. Many drugs such as Haloperidol (a psychosomatic drug) and Naltrexone (an opioid antagonist drug) have recently been made available as long acting injections in the form of microspheres. Prescribing these long acting medications is no easy task. Doctors will need tools and methods to aid them in achieving optimal blood plasma drug concentrations (BPDC) in their patients. We have created one such tool. This prescription program analyzes a patient’s drug metabolism and microsphere drug release rate to calculate the correct dosage of microspheres to be injected. An economic analysis was also performed to assess the profitability of producing microsphere injections, specifically for alcoholism, in the pharmaceutical market. - Step 1: Patient is injected with the desired drug intravenously. Step 2: The Blood Concentration of that drug is measured for a period of 1 to 24 hours. Step 3: The doctor obtains the patients metabolic rate by the blood concentration levels. Step 4: The doctor inputs all information into our program and receives a calculated prescription. Step 5: The patient is injected with the extended release prescription. The typical drug concentrations in the blood when an oral medication is taken daily (left) and a single extended release injection (right). The target drug concentration is notated by the dashed line. - Results (Top Left) A chart of concentration of drug in the body versus drug clearance. The rate of clearance is described as a function of drug concentration in the blood. The parameters D and delta are specific to each patient and must be measured (Step 3 of Method).(Top Right) Nine different microsphere types were used in the prescription program. These release profiles were used to calculate the optimal mass of each individual type of microsphere to achieve the target drug concentration in the body. (Bottom) A chart of drug concentration in the blood versus time in days. The pink line represents the target concentration that can be specified by a doctor, and the blue line is the actual drug concentration circulating in the blood. The Prescription program chooses the mass of each of the nine types of microspheres that will produce the target drug concentration. Conclusions We have created a computer simulation that models the drug concentration in a person’s blood stream. With this program a doctor can specify a target blood drug concentration. The computer simulation will then calculate the correct dosage of microspheres that will achieve this target blood drug concentration. We predict that this method of prescribing microspheres will become essential for future medications because of the many drugs that will soon be administered in microsphere form. Microspheres (Left) Microspheres are used as extended release delivery system. This is and image of PLGA microspheres taken with a simple light microscope. These microspheres are loaded with a drug which will be release when the microspheres are injected into a patient. (Right) Light micrograph of intramuscular microspheres after 3 months of follow-up3 m = muscular tissue cbv = capillary blood vessel. The arrow points to an endothelial cell in the capillary’s wall. Scale bar = 100 micrometers. Drug References and Acknowledgements YahyaLazrakRufei Lu Warren Yates SamanehNoor-Mohammadi 1. Microspheres for Controlled Release Drug Delivery. Neelesh K. Varde and Daniel W. Pack, 2004 in Expert Opinion in Biological Theory, 4(1): 35-51. 2. On the Role of Microeconomics, Multiscale Planning and Finances in Product Design, M. Bagajewicz. 3. Development of new injectable bulking agents:Biocompatibility of radiopaque polymeric microspheresstudied in a mouse model, Pieter J. Emans, KetieSaralidze, Menno L. W. Knetsch, Marion J. J. Gijbels, RoelKuijer,Leo H. Koole, 2005 in Wiley InterScience 73A: 430-436. The demand model used to calculate quantity demanded at each price2 (top). A chart of net present value (NVP) versus time in years for the $50 and $75 price of the monthly microsphere injection (middle). The net present value for the microsphere production process over a ten year period. Nine different prices were compared ranging from $25 per month to $250 per month (bottom). 100 μm