
Effects of DiOHF and Quercetin on Cytochrome c Reduction in DMSO-Differentiated HL-60 Cells
E N D
Presentation Transcript
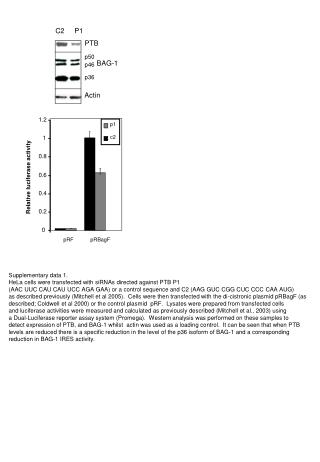
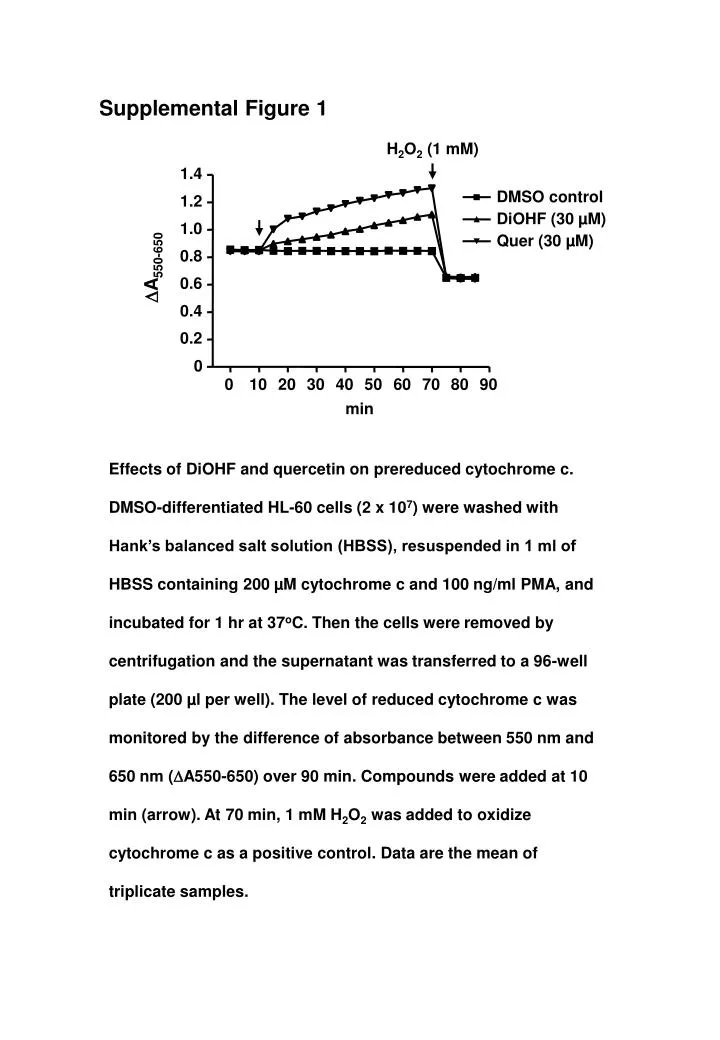
Supplemental Figure 1 H2O2 (1 mM) 1.4 DMSO control 1.2 DiOHF (30 µM) 1.0 Quer (30 µM) 0.8 A550-650 0.6 0.4 0.2 0 0 10 20 30 40 50 60 70 80 90 min Effects of DiOHF and quercetin on prereduced cytochrome c. DMSO-differentiated HL-60 cells (2 x 10⁷) were washed with Hank’s balanced salt solution (HBSS), resuspended in 1 ml of HBSS containing 200 µM cytochrome c and 100 ng/ml PMA, and incubated for 1 hr at 37oC. Then the cells were removed by centrifugation and the supernatant was transferred to a 96-well plate (200 µl per well). The level of reduced cytochrome c was monitored by the difference of absorbance between 550 nm and 650 nm (A550-650) over 90 min. Compounds were added at 10 min (arrow). At 70 min, 1 mM H2O2 was added to oxidize cytochrome c as a positive control. Data are the mean of triplicate samples.
Supplemental Figure 2 DMSO - + p47phox p67phox Nox2 -tubulin Western blots showing that differentiation of HL-60 with DMSO (1.5%) for 3 days significantly increased the expression of p47phox and p67phox, whereas the level of Nox2 remained low.
![Altitude= [0.2, 4.0km]](https://cdn4.slideserve.com/464372/nasa-s-cloud-absorption-radiometer-dt.jpg)