Download
1 / 4
40 likes | 195 Views
NASA’s Cloud Absorption Radiometer (CAR): Understanding Surface Bidirectional Reflectance Variability at Sub-Pixel Scales Miguel O. Román, Code 614.5, NASA/GSFC. (a.). Plot #2: Corn (QuickBird 2.4m) (36.6183N, -97.4939E). 60m CAR BRFs aggregated to 60m*. (b.). CLASIC’07 Flight #1928.

E N D
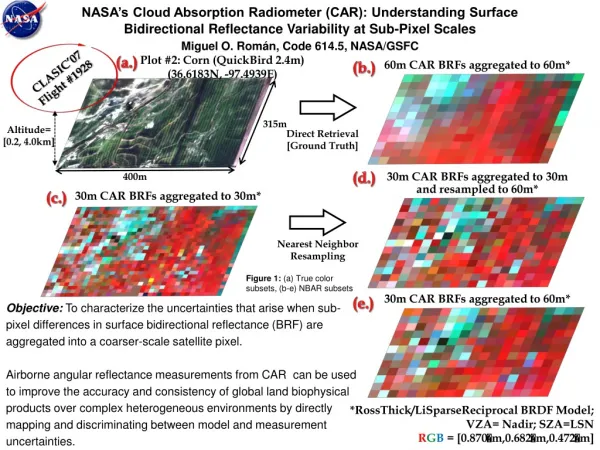
NASA’s Cloud Absorption Radiometer (CAR): Understanding Surface Bidirectional Reflectance Variability at Sub-Pixel Scales Miguel O. Román, Code 614.5, NASA/GSFC (a.) Plot #2: Corn (QuickBird 2.4m) (36.6183N, -97.4939E) 60m CAR BRFs aggregated to 60m* (b.) CLASIC’07 Flight #1928 315m Altitude= [0.2, 4.0km] Direct Retrieval [Ground Truth] (d.) 400m 30m CAR BRFs aggregated to 30m and resampled to 60m* (c.) 30m CAR BRFs aggregated to 30m* Nearest Neighbor Resampling Figure 1: (a) True color subsets, (b-e) NBAR subsets 30m CAR BRFs aggregated to 60m* (e.) Objective: To characterize the uncertainties that arise when sub- pixel differences in surface bidirectional reflectance (BRF) are aggregated into a coarser-scale satellite pixel. Airborne angular reflectance measurements from CAR can be used to improve the accuracy and consistency of global land biophysical products over complex heterogeneous environments by directly mapping and discriminating between model and measurement uncertainties. *RossThick/LiSparseReciprocal BRDF Model; VZA= Nadir; SZA=LSN RGB = [0.870m,0.682m,0.472m]
Name: Miguel O. Román, NASA/GSFC E-mail: Miguel.O.Roman@nasa.gov Phone: 301-614-5811 References: Román, M.O., Gatebe, C.K., Schaaf, C.B., & King, M.D. (2010). Characterization of Surface Directional Reflectance Properties over the US Southern Great Plains during the 2007 CLASIC Experiment. Remote Sensing of Environment (Submitted). Data Sources: CAR airborne datasets over the US Southern Great Plains (available at http://climate.gsfc.nasa.gov/car/data/) were acquired during the 2007 Cloud and Land Surface Interaction Campaign (CLASIC ‘07) sponsored by DOE-ARM and NASA's EOS Program. Technical Description: (a.) True-color subset from a 2.4 m QuickBird scene acquired just 7 days after CLASIC Flight #1928 (1 July 2007) over a plot of corn located outside of Lamont, Oklahoma. Multiple clockwise circular flight patterns were taken at several heights above ground level (from 0.2-4.0km) to achieve a low noise level and an even sampling of spatial and directional space. (b.-e.)Nadir BRDF Adjusted Reflectance (NBAR) subsets (VZA= Nadir; SZA=LSN; RGB = [0.472m,0.682m,.0870m] ) obtained from RossThick/LiSparseReciprocal BRDF model inversions of CAR Bidirectional Reflectances at 30m and 60m spatial resolutions. The objective scale (60m) was directly sampled by (b.) aggregating 60m CAR BRFs to a 60m grid; and indirectly sampled by (c.-d.) aggregating 30m CAR BRFs to a 30m grid and then resampling the 30m grid to a 60m grid; and (e.) aggregating 30m CAR BRFs to a 60m grid. Scientific significance: A current challenge when validating satellite-derived land biophysical products against coincident in-situ datasets is the occurrence of retrieval uncertainties (e.g., sub-pixel heterogeneity, scaling, and aggregation effects) that are very difficult to quantify and are oftentimes ignored. This remains a barrier to our understanding of the Earth system processes that global land products are meant to describe; ultimately affecting our ability to quantify how changes due to anthropogenic activity can affect long-term climate trends. The Cloud Absorption Radiometer (CAR) is the only instrument from NASA’s suite of airborne remote sensing systems that can acquire a well-distributed set of angular reflectance measurements for a given surface location, at a specific time, under multiple illumination and viewing conditions, and at multiple spatial scales. This provide us with insight into issues of scale-dependent uncertainties and a rare opportunity to map the effects of scale on the accuracy of Climate Data Records (CDRs) and Earth System Data Records (ESDRs). Relevance for future science and relationship to Decadal Survey: As we move into the Decadal Survey’s timeframe, a major goal stated in the NASA Earth Science Research Strategy is to “develop long-term, consistent, climate-quality global land products that are valid across multiple missions and satellite sensors”. This goes in step with the development of a dedicated measurement program of terrestrial essential climate variables (GEO/CEOS/GCOS/GTOS) in collaboration with our national (e.g. NOAA and USDA) and international partners (EUMETSAT, NSC, ISRO, JAXA). As a result, there is a real expectation to more directly map through the uncertainties from sensors to products by identifying and validating systematic errors, and improving error estimations in CDRs and ESDRs.
Increasing Ice Production and Enhanced Salinization in the Ross Sea Coastal Polynya JosefinoComiso, Code 614.1, NASA GSFC The Arctic total and perennial sea ice areas have been declining at a relatively high rate of about -4% and -13% per decade, respectively. Unexpectedly, the Antarctic ice area has been increasing at the rate of about 1 to 2% per decade. The reason is believed to be the ozone hole that is reported to have caused a deepening of the lows in West Antarctica and enhanced winds off the Ross Ice Shelf. This study provides direct supporting evidence that since 1992: (a) ice production in the Ross Sea shelf region has been enhanced (Fig. 1) and (b) the percentage of sea ice drifting off the shelf region has been increasing (Fig. 2). Figure 1 Figure 2: Increasing percentage of sea ice drifting off the shelf region Figure 1: Ice Production in the Ross Sea shelf region
Name: Josefino C. Comiso, NASA/GSFC E-mail: josefino.c.comiso@nasa.gov Phone: 301-614-5708 References: Comiso, J., R. Kwok, S. Martin, and A. Gordon, (2010, in review) Variability and trends in sea ice extent and ice production in the Ross Sea, J. Geophysical Res. Turner, J., J. Comiso, G.J. Marshall. W.M. Connolley, T.A. Lachlan-Cope, T. Bracegirdle, Z./ Wang, M. Meredith, and T. Maksym (2009), Antarctic sea ice extent increases as a result of anthropogenic activity, Geophy. Res. Lett., 36, L08502, doi:10.1029/2009GLl037524. Comiso, J. C. (2010), Polar Oceans from Space, Springer, New York, 507 pp. Data Sources: The study made use of ice concentration, ice drift velocity and ice thickness data derived primarily from Nimbus-7 Scanning Multichannel Microwave Radiometer (SMMR), DMSP/Special Scanning Microwave Imager (SSM/I) and EOS-Aqua/Advanced Multichannel Microwave Radiometer (AMSR-E). Monthly average of sea level pressure and winds from the National Centers for Environmental Prediction (NCEP) – National Center for Atmospheric Research (NCAR) reanalysis output data were also utilized to interpret the results. Technical Description of Image: Figure 1: Annual values of ice production and salinity enhancement derived primarily from the Ross Sea coastal polynya using ice thickness information inferred from SMMR, SSM/I and AMSR-E data. The plots provide estimates (with error bars) of two parameters with the scale on the left side representing the ice production (in volume) while the scale on the right representing the same curve but in units of salinization (in psu). The six data points connected by dash lines are from AMSR-E data. The result from regression analysis indicates that ice production doubles from 300 to 600 km3/year or a rate of increase of 20 km3/year. Figure 2: Interannual variability of ice drift velocities in the Ross Sea region. Isobars of sea level pressure from NCEP-NCAR reanalysis data with contour intervals of 4 hPa are also shown. The quantities at the top right corner are the mean and standard deviation of the drift speed in km/day of the vectors within the domain. The quantities on the top right corner are the mean and standard deviation of the drift speed in km/day of the vectors within the shelf region. The average net outflow over the 1992 to 2008 period is 1.0 x 10⁶ km2 per year but increasing at the rate of 30 x 103km2/winter or 20 km3/winter assuming an average ice thickness of 0.6 m. This result is consistent with that derived independently from ice thickness as indicated in Fig. 1. Scientific significance: The observed increase in the extent of the Antarctic sea ice cover has been counter intuitive because of global warming during the period. The increase in ice cover has been primarily concentrated in the Ross Sea while significant decline has been observed in the Bellingshausen and Amundsen Seas. We show in this study that the rate of ice production in the Ross Sea has been increasing since 1992. This is consistent with the observed deepening of the lows in West Antarctica causing southerly winds to be stronger off the Ross ice shelf. The latter caused enhanced polynya formation that in turn lead to more new ice formation and hence, higher ice production and salinization as indicted in Fig. 1. Results from studies of ice drift velocities in the region (Fig. 2) is also consistent with this result. Relevance for future science and relationship to Decadal Survey: The Ross Sea (together with the Weddell Sea) has been known to be the primary source of high salinity bottom water that becomes part of the thermohaline circulation of the world’s oceans. Ice production in the Ross Sea needs to be studied on a long term (decadal) basis because a change in the rate of production would mean a change in salinization that in turn would impact the ocean circulation which is an important component of the Earth’s climate. The survey of ice production is expected to be continued in the near future because of upcoming launches of visible, infrared and microwave sensors on board NPP and NPOESS and of the JAXA - Advanced Microwave Scanning Radiometer (AMSR-2) on board GCOM-W. The upcoming launch of ICESAT-2 would further improve the accuracy in the determination of ice production.


