
Uploaded by
vincent-warner
1 SLIDES
108 VIEWS
10LIKES
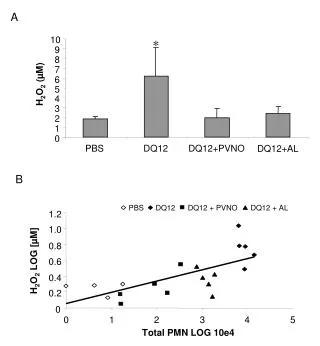
Comparative Analysis of DQ12 and PVNO Treatments on H2O2 Levels in PMN Cells
DESCRIPTION
Explore the impact of DQ12 and PVNO on H2O2 concentrations in PMN cells, analyzed using a logarithmic scale. The study investigates how these treatments influence H2O2 levels and cell responses. Insights can aid in understanding cellular oxidative stress mechanisms and potential therapeutic strategies.
Download
1 / 1
Download Presentation 
Comparative Analysis of DQ12 and PVNO Treatments on H2O2 Levels in PMN Cells
An Image/Link below is provided (as is) to download presentation
Download Policy: Content on the Website is provided to you AS IS for your information and personal use and may not be sold / licensed / shared on other websites without getting consent from its author.
Content is provided to you AS IS for your information and personal use only.
Download presentation by click this link.
While downloading, if for some reason you are not able to download a presentation, the publisher may have deleted the file from their server.
During download, if you can't get a presentation, the file might be deleted by the publisher.
E N D
Presentation Transcript
A 10 * 9 8 7 6 H2O2 (µM) 5 4 3 2 1 0 PBS DQ12 DQ12+PVNO DQ12+AL PBS DQ12 DQ12 + PVNO DQ12 + AL 1.2 1.0 0.8 H2O2 LOG [µM] 0.6 B 0.4 0.2 0 0 1 2 3 4 5 Total PMN LOG 10e4
![Altitude= [0.2, 4.0km]](https://cdn4.slideserve.com/464372/nasa-s-cloud-absorption-radiometer-dt.jpg)


More Related