Modeling Discrete Variables
Modeling Discrete Variables. Lecture 22-1 Sections 6.4 Wed, Mar 1, 2006. Two Types of Variable. Discrete variable – A variable whose set of possible values is a set of isolated points on the number line.

Modeling Discrete Variables
E N D
Presentation Transcript
Modeling Discrete Variables Lecture 22-1 Sections 6.4 Wed, Mar 1, 2006
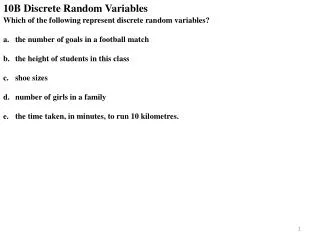
Two Types of Variable • Discrete variable – A variable whose set of possible values is a set of isolated points on the number line. • Continuous variable – A variable whose set of possible values is a continuous interval of real numbers.
Example of a Discrete Variable • Suppose that 10% of all households have no children, 30% have one child, 40% have two children, and 20% have three children. • Select a household at random and let X = number of children. • What is the distribution of X?
Example of a Discrete Variable • We may list each value and its proportion. • For 0.10 of the population, X = 0. • For 0.30 of the population, X = 1. • For 0.40 of the population, X = 2. • For 0.20 of the population, X = 3.
Example of a Discrete Variable • Or we may present it as a table.
Graphing a Discrete Variable • Or we may present it as a stick graph. P(X = x) 0.40 0.30 0.20 0.10 x 0 1 2 3
Graphing a Discrete Variable • Or we may present it as a histogram. P(X = x) 0.40 0.30 0.20 0.10 x 0 1 2 3
Discrete Random Variables Lecture 22-2 Section 7.5.1 Wed, Mar 1, 2006
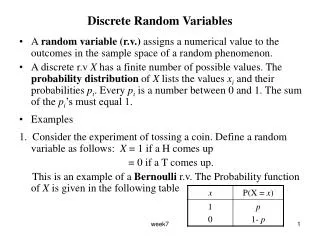
Random Variables • Random variable – A variable whose value is determined by the outcome of a procedure. • The procedure includes at least one step whose outcome is left to chance. • Therefore, the random variable takes on a new value each time the procedure is performed, even though the procedure is exactly the same.
Types of Random Variables • Discrete Random Variable – A random variable whose set of possible values is a discrete set. • Continuous Random Variable – A random variable whose set of possible values is a continuous set.
A Note About Probability • The probability that something happens is the proportion of the time that it does happen out of all the times it was given an opportunity to happen. • Therefore, “probability” and “proportion” are synonymous in the context of what we are doing.
Examples of Random Variables • Roll two dice. Let X be the number of sixes. • Possible values of X = {0, 1, 2}. • Roll two dice. Let X be the total of the two numbers. • Possible values of X = {2, 3, 4, …, 12}. • Select a person at random and give him up to one hour to perform a simple task. Let X be the time it takes him to perform the task. • Possible values of X are {x | 0 ≤ x ≤ 1}.
Discrete Probability Distribution Functions • Discrete Probability Distribution Function (pdf) – A function that assigns a probability to each possible value of a discrete random variable.
Rolling Two Dice • Roll two dice and let X be the number of sixes. • Draw the 6 6 rectangle showing all 36 possibilities. • From it we see that • P(X = 0) = 25/36. • P(X = 1) = 10/36. • P(X = 2) = 1/36.
Rolling Two Dice • We can summarize this in a table.
Example of a Discrete PDF • Or we may present it as a stick graph. P(X = x) 30/36 25/36 20/36 15/36 10/36 5/36 x 0 1 2
Example of a Discrete PDF • Or we may present it as a histogram. P(X = x) 30/36 25/36 20/36 15/36 10/36 5/36 x 0 1 2
Example of a Discrete PDF • Suppose that 10% of all households have no children, 30% have one child, 40% have two children, and 20% have three children. • Select a household at random and let X = number of children. • Then X is a random variable. • Which step in the procedure is left to chance? • What is the pdf of X?
Example of a Discrete PDF • We may present the pdf as a table.
Example of a Discrete PDF • Or we may present it as a stick graph. P(X = x) 0.40 0.30 0.20 0.10 x 0 1 2 3
Example of a Discrete PDF • Or we may present it as a histogram. P(X = x) 0.40 0.30 0.20 0.10 x 0 1 2 3