Discrete Random Variables
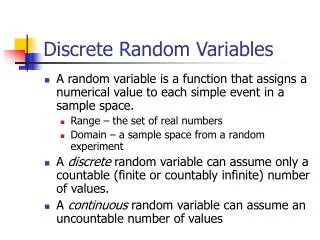
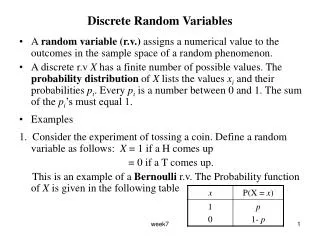
Discrete Random Variables. Random Variables – What We Know. A random variable is a function that associates a unique numerical value with every outcome of an experiment. The value of a random variable changes from occurrence to occurrence.


Discrete Random Variables
E N D
Presentation Transcript
Random Variables – What We Know • A random variable is a function that associates a unique numerical value with every outcome of an experiment. • The value of a random variable changes from occurrence to occurrence. • Although we don’t know the next value of a random variable, we do know the overall pattern of the values assumed by a random variable over many repetitions. G. Baker, Department of Statistics University of South Carolina; Slide 2
Categorical Random Variables Molding Defects: Type Freq Blk Spots 100 Scratches 40 Splay 35 Sinks 15 Flow Lines 12 Other 20 Black Spot Locations Location Freq Top 70 Mid 10 Bottom 10 Left 5 Right 5 G. Baker, Department of Statistics University of South Carolina; Slide 3
Numerical Random Variables • Assume numerical values from a meaningful numerical scale. • Example: • Age is a numerical variable. • Zip code is a categorical random variable. G. Baker, Department of Statistics University of South Carolina; Slide 4
Life of a Light Bulb in Hours G. Baker, Department of Statistics University of South Carolina; Slide 5
Notation • We will use capital letters from the end of the alphabet to represent a random variable. • Usually X or Y • The corresponding lower case letter will represent a particular value of the random variable. • P(Y = y) is the probability that the random variable Y is equal to the value y. G. Baker, Department of Statistics University of South Carolina; Slide 6
Discrete and Continuous Random Variables • A continuous random variable can take any value in an interval of the real number line. • Usually measurements • A discrete random variable can take one of a countable list of distinct values. • Usually counts G. Baker, Department of Statistics University of South Carolina; Slide 7
Numeric Random Variables Continuous Discrete 16.0 16.2 16.4 Number of Active Pumps Ounces G. Baker, Department of Statistics University of South Carolina; Slide 8
Discrete and Continuous Random Variables • Discrete or continuous? • Time until a projectile returns to earth. • The number of times a transistor in computer memory changes state in one operation. • The volume of gasoline that is lost to evaporation during the filling of a gas tank. • The outside diameter of a machined shaft. • The number of chapters in your text book. G. Baker, Department of Statistics University of South Carolina; Slide 9
Discrete Numeric Random Variables • A small airport in New Zealand is interested in the number of late aircraft arrivals per day. Every day for a year it counts the daily number of late arrivals. Let random variable Y = Number of aircraft in one day that arrive late. G. Baker, Department of Statistics University of South Carolina; Slide 10
Discrete Numeric Random Variables • What is the probability that on any randomly chosen day that 3 aircraft are late? • What is the chance that on any randomly chosen day at least 1 aircraft is late? G. Baker, Department of Statistics University of South Carolina; Slide 11
Discrete Numeric Random Variables • An assembly consists of three mechanical components. Suppose that the probabilities that the first, second, and third components meet specifications are 0.90, 0.95 and 0.99 respectively. Assume the components are independent. • Let Si = the event that a component is within specification. G. Baker, Department of Statistics University of South Carolina; Slide 12
Possible Outcomes for One assembly 0.00495 0.00005 Let Y = Number of components within specification in a randomly chosen assembly Y 0 1 2 3 P(Y=y) 0.00005 0.00635 0.14715 0.84645 G. Baker, Department of Statistics University of South Carolina; Slide 13
Discrete Random Variables • Probability or Distribution Function p(y) = P(Y = y) Note: 0 < p(y) < 1 for every value of y and G. Baker, Department of Statistics University of South Carolina; Slide 14
Probability Function for a Discrete Random Variable can be expressed as a table or graph and sometimes as a formula. Y 0 1 2 3 P(Y=y) 0.00005 0.00635 0.14715 0.84645 G. Baker, Department of Statistics University of South Carolina; Slide 15
Cumulative Probability or Distribution Function • If Y is a random variable, then the cumulative distribution function is denoted by F(y). • F(y) = P(Y < y) G. Baker, Department of Statistics University of South Carolina; Slide 16
Number of Components within Specification for a Randomly chosen Assembly Distribution Function: Y 0 1 2 3 P(Y=y) 0.00005 0.00635 0.14715 0.84645 Cumulative Distribution Function: Y 0 1 2 3 P(Y<y) 0.00005 0.00640 0.15355 1.0000 G. Baker, Department of Statistics University of South Carolina; Slide 17
Cumulative Distribution Function Distribution Function P(Y < y) P(Y = y) G. Baker, Department of Statistics University of South Carolina; Slide 18
Expected Value • Note, this distribution is the distribution for a population • The expected value of the population is the population mean, µ, for the distribution. Y 0 1 2 3 P(Y=y) 0.00005 0.00635 0.14715 0.84645 G. Baker, Department of Statistics University of South Carolina; Slide 19
Number of Components within Specification on a Randomly Chosen Assembly G. Baker, Department of Statistics University of South Carolina; Slide 20
Variance Y 0 1 2 3 P(Y=y) 0.00005 0.00635 0.14715 0.84645 • The variance of the population is the expected value of (Y - µ)2. G. Baker, Department of Statistics University of South Carolina; Slide 21
Computational Formula for Variance G. Baker, Department of Statistics University of South Carolina; Slide 22
Population Standard Deviation Standard Deviation is the positive square root of the variance. G. Baker, Department of Statistics University of South Carolina; Slide 23
We receive 75% of a certain part from Supplier A and 25% from supplier B. Two of these parts are used in an assembly. Let Y = number of parts from Supplier A in the assembly. What is the expected value of Y? G. Baker, Department of Statistics University of South Carolina; Slide 24
A project manager for an engineering firm submitted bids on three projects. The following table summarizes the firm’s chances of having the three projects accepted. Project A B C Prob of accept 0.30 0.80 0.10 Assuming the projects are independent of one another, what is the probability that the firm will have all three projects accepted? G. Baker, Department of Statistics University of South Carolina; Slide 25
What is the probability of having at least one project accepted? Project A B C Prob of accept 0.30 0.80 0.10 G. Baker, Department of Statistics University of South Carolina; Slide 26
Let Y = number of projects accepted. y 0 1 2 3 p(y) 0.126 0.572 0.278 0.024 What is the expected number of projects accepted? G. Baker, Department of Statistics University of South Carolina; Slide 27
Let Y = number of projects accepted. y 0 1 2 3 p(y) 0.126 0.572 0.278 0.024 What is the variance for number of projects accepted? G. Baker, Department of Statistics University of South Carolina; Slide 28
Rules of Expectation • E(c) = c • E(cY) = cE(Y) • E(X + Y) = E(X) + E(Y) G. Baker, Department of Statistics University of South Carolina; Slide 29
Consider the following process: 5 1 1 G. Baker, Department of Statistics University of South Carolina; Slide 30
Rules of Variance • Var(c) = 0 • Var(cY) = c2Var(Y) • Var(X + Y) = Var(X) + Var(Y) G. Baker, Department of Statistics University of South Carolina; Slide 31
Binomial Random Variable • Suppose we toss a fair coin 20 times, counting the number of heads. • This is an example of a binomial experiment. • The possible outcomes can be represented with a binomial random variable which follows a binomial distribution. G. Baker, Department of Statistics University of South Carolina; Slide 32
Binomial Experiment • Y represents the outcome of n identical trials. • There are two possible outcomes for each trial: success and failure. • Outcomes are independent from trial to trial. • Probability of success, p, remains constant from trial to trial. G. Baker, Department of Statistics University of South Carolina; Slide 33
Binomial Experiment • Each toss of the coin is a trail. We performed 20 trials. So n = 20. • The two possible outcomes of a trials are heads or tails. Since we are counting heads, heads is a success, while tails is a failure. • Are the outcomes of our trials independent of one another? • Probability of success (heads) is 0.50 G. Baker, Department of Statistics University of South Carolina; Slide 34
Binomial Experiment • A manufacturer of water filters for refrigerators monitors the process for defective filters. Historically, this process averages 5% defective filters. • Suppose five filters are randomly selected for testing and we count number of defective filters. • Define a trial. • Calculate n. • Define a “success”. • Are the outcomes independent from trial to trial? • Calculate p. G. Baker, Department of Statistics University of South Carolina; Slide 35
Water Filters • A manufacturer of water filters for refrigerators monitors the process for defective filters. Historically, this process averages 5% defective filters. Five filters are randomly selected. • Find the probability that all five filters are defective. • Find the probability that no filters are defective. • Find the probability that exactly 1 filter is defective. G. Baker, Department of Statistics University of South Carolina; Slide 36
A manufacturer of water filters for refrigerators monitors the process for defective filters. Historically, this process averages 5% defective filters. Five filters are randomly selected. • Find the probability that exactly 2 filters are defective. 5(.05)2(.95)3 10(.05)2(.95)3 15(.05)2(.95)3 G. Baker, Department of Statistics University of South Carolina; Slide 37
Remember Combinations • Number of ways to choose r distinct objects from n distinct objects: “n choose r” G. Baker, Department of Statistics University of South Carolina; Slide 38
Probability Function for a Binomial Random Variable for y = 0, 1, 2, …,n G. Baker, Department of Statistics University of South Carolina; Slide 39
If Y follows a Binomial Distribution Binomial mean Binomial variance Binomial standard deviation G. Baker, Department of Statistics University of South Carolina; Slide 40
Suppose we are producing 15% defective filters. Let Y = Number of Defective Filters in a Sample of 10 G. Baker, Department of Statistics University of South Carolina; Slide 41
What is the approximate probability that there will be at least 1 defective filter in a sample of 10? G. Baker, Department of Statistics University of South Carolina; Slide 42
Historically, 10% of homes in Florida have radon levels higher than that recommended by the EPA. In a random sample of 20 homes, find the probability that exactly 3 have radon levels higher than the EPA recommendation. Assume home are independent of one another. G. Baker, Department of Statistics University of South Carolina; Slide 43
If a manufacturing process has a 0.03 defective rate, what is the probability that at least one of the next 25 units inspected will be defective? • (0.03)1 * (0.97)24 • 1 – (0.03)1 * (0.97)24 • 1 – (0.03)0 * (0.97)25 • 1 – (0.03)25 G. Baker, Department of Statistics University of South Carolina; Slide 44
A manufacturing process has a 0.03 defective rate. If we randomly sample 25 units • What is the probability that less than 6 will be defective? • What is the probability that 4 or more are defective? • What is the probability that between 2 and 5, inclusive, are defective? G. Baker, Department of Statistics University of South Carolina; Slide 45
Golf Resort • At a particular golf resort, if a person hits a hole-in-one, the player gets to select 4 slips of paper from a bin of 100 slips. Of the 100 slips of paper, 2 are good for a brand new driver valued at $300. So if the person selects 1 or 2 slips good for the driver, he gets the driver. • Is this a binomial experiment? • We can get the answer using straight probability. G. Baker, Department of Statistics University of South Carolina; Slide 46
Golf Resort • Let Y = number of slips chosen that are good for a free driver. • To win, the player must draw 1 or 2 of the 2 slips which entitle him to a free driver. • P(Y = 1 or 2) = P(Y = 1) + P(Y = 2) • Recall: G. Baker, Department of Statistics University of South Carolina; Slide 47
Probability of Winning Driver G. Baker, Department of Statistics University of South Carolina; Slide 48
Hypergeometric Distribution • Models the number of successes out of n trials when sampling without replacement from a finite population of N objects that contains exactly r successes. for y = 0, 1, 2,…,n G. Baker, Department of Statistics University of South Carolina; Slide 49
Hypergeometric Distribution • Expected Value: G. Baker, Department of Statistics University of South Carolina; Slide 50