Download
1 / 13
130 likes | 259 Views
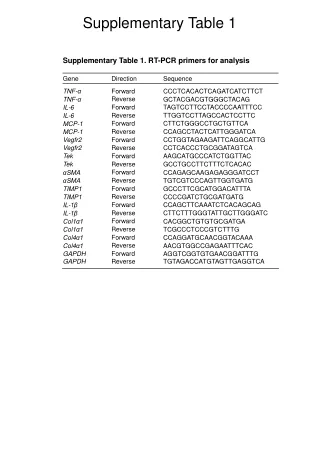
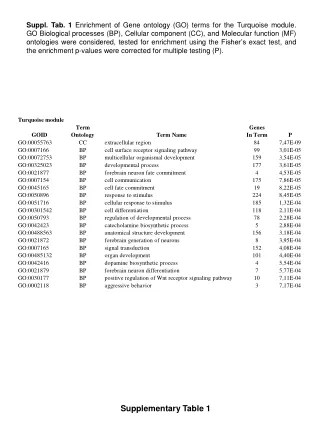
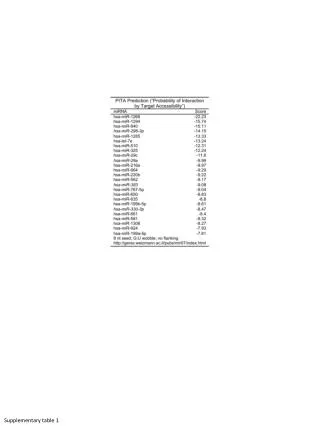
This study explores the role of TRF1 and miR-155 in the regulation of telomeric function and their implications in cancer biology. Key findings include the impact of miR-155 on TRF1 protein levels and mRNA expression, as well as fluorescence intensity measurements related to telomere dynamics. The data is presented through multiple supplementary figures and tables, highlighting variations in telomere length and the frequency of telomere dysfunction across various tumor samples. Statistical significance is noted, indicating potential pathways for therapeutic intervention.

E N D
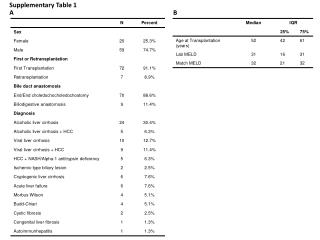
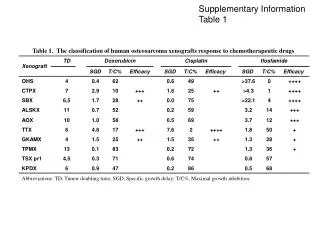
A. B. Supplementary table 4
A. B. C. Supplementary Fig. S1
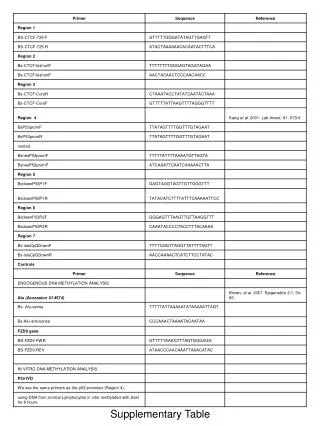
A. B. miR-155 control siTRF1 miR-155 control siTRF1 - - + + MG132 - - + + MG132 Flag-TRF1 20mg WB a-TRF1 2mg WB a-TRF1 Flag-TRF1 end. TRF1 * actin actin p=0.3 1.00 2.55 1.13 2.05 end. TRF1/actin 1.00 1.38 0.52 0.71 0.18 p=0.2 p=0.012 n=3 n=3 n=3 n=3 C. TRF1 mRNA levels normalized to actin (con.miRNA set “1”) n=3 Flag-TRF1/actin Supplementary Fig. S2
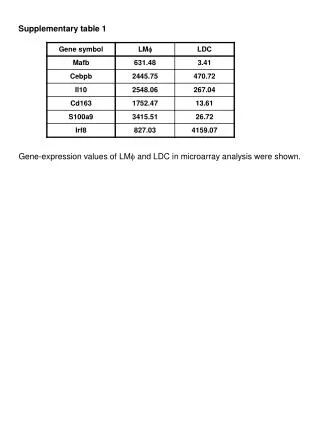
ER positive tumors miR-155 signature low: n=593 miR-155 signature high: n=606 Supplementary Fig. S3
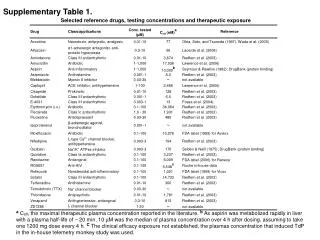
A. B. p<0.0001 8000 TRF2 TRF2/DAPI 1464 ±37.79 n=508 N= 31 TRF1 TRF1/DAPI p<0.0001 7000 1312 ±30.52 n=602 N=41 control 6000 1051 ±31.08 n=512 N= 40 control 20000 5000 18000 miR-155 TRF1 fluorescence intensity (a.f.u) 4000 16000 miR-155 14000 3000 antago- miR-155 12000 2000 POT1 fluorescence intensity (a.f.u) 10000 U 2-OS antago- miR-155 1000 8000 MBA-MD-468 0 6000 control 4000 miR-155 a-miR-155 antago-miR-155 2000 C. D. control miR-155 a-miR-155 p=0.4 p=0.065 1619 ±54.45 n=1173 N=48 1694 ±51.07 n=1050 N= 48 1584 ±41.40 n=1267 N= 48 p=0.119 p=0.071 1552 ±86.24 n=1552 N= 37 985 ±101.4 n=985 N= 30 1199 ±101.7 n=1199 N=35 POT1 POT1/DAPI control 15000 miR-155 10000 antago- miR-155 TRF2 fluorescence intensity (a.f.u) 5000 1000 control miR-155 a-miR-155 Supplementary Fig. S4
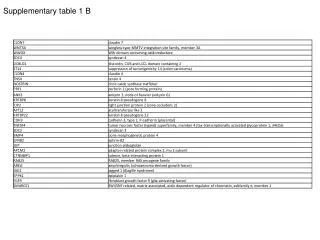
A. B. miR-155 control p=0.01 TRF1 p<0,0001 n=3 p<0.0001 actin n=3 n=3 TRF1 protein levels normalized versus actin miR-155 levels normalized versus RNU46 D. C. n=3 p=0.2 n=3 TRF1 mRNA levels normalized versus actin n=3 p=0.2 TRF2 mRNA levels normalized versus actin n=3 n=3 E. 1591 ± 30.72 N=42 n=3823 1916 ± 37.47 N=39 n=3521 16000 14000 12000 C telomerea.f.uintesistycategories (%) 10000 telomerelength(a.f.u.) 8000 6000 4000 B 2000 A 0 control miR-155 Supplementary Fig. S5
A. p=0.035 N=3 n=50 N=3 TIF frequency (2< TIFs; %) n=50 miR-155 levels, normlized to RNU46 (con set “1”) B. C. D. p=0.05 miR-155 N=3 control n=93 TRF1 control N=3 miR-155 actin n=81 TIF frequency 3< TIFs; %) Supplementary Fig. S6
A. B. p=0,003 p= 0,03 C. D. N=40 n=3098 N=20 n=1533 N=40 n=3084 N=17 n=1370 p= 0,04 fragile telomeres (%) fragile telomeres (%) p=0.05 N=25 n=1906 N=21 N=1542 N=25 n=1974 N=26 n=2134 fragile telomeres (%) telomeric sister chromatid fusions (%) + con.miRNA + con.miRNA + + - - - - antago-miR-155 - + Aphidicolin - + Aphidicolin antago-miR-155 Supplementary Fig. S7