Analysis of SNP Associations in Colorectal Cancer: Screening and Replication Studies
This document presents a comprehensive analysis of single nucleotide polymorphisms (SNPs) associated with colorectal cancer across various stages, including colon, proximal colon, distal colon, and rectal cancer. The results are ranked by p-values from Cochran-Armitage trend tests and include odds ratios (OR), confidence intervals (CI), and evaluations of Hardy-Weinberg equilibrium (HWE). Additionally, replication studies and meta-analyses were conducted in a Japanese population, reinforcing the significance of identified SNPs. The chromosomal positions are based on NCBI build 36.

Analysis of SNP Associations in Colorectal Cancer: Screening and Replication Studies
E N D
Presentation Transcript
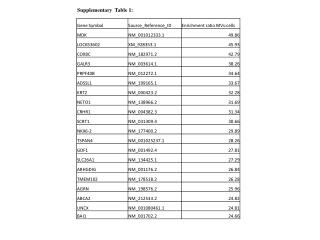
Supplementary Table 2 The results of screening stage analysis of colorectal cancer SNPs were ranked according to their p Value in the screening stage of colorectal cancer. OR, Odds ratio; CI, confidence interval. ||Significance level for the departures from Hardy Weinberg equilibrium (HWE)in the control samples. †OR of minor allele from 2x2 allele frequency table. ‡p Values derived from Cochran-Armitage trend tests. Chromosomal positions are from NCBI build 36.
Supplementary Table 3 The results of screening stage analysis of colon cancer SNPs were ranked according to their p Value in the screening stage of colon cancer. OR, Odds ratio; CI, confidence interval. ||Significance level for the departures from Hardy Weinberg equilibrium (HWE) in the control samples. †OR of minor allele from 2x2 allele frequency table. ‡ p Values derived from Cochran-Armitage trend tests. Chromosomal positions are from NCBI build 36.
Supplementary Table 4 The results of screening stage analysis of proximal colon cancer SNPs were ranked according to their p Value in the screening stage of proximal colon cancer. OR, Odds ratio; CI, confidence interval. ||Significance level for the departures from Hardy Weinberg equilibrium (HWE) in the control samples. †OR of minor allele from 2x2 allele frequency table. ‡ p Values derived from Cochran-Armitage trend tests. Chromosomal positions are from NCBI build 36.
Supplementary Table 5 The results of screening stage analysis of distal colon cancer SNPs were ranked according to their p Value in the screening stage of distal colon cancer. OR, Odds ratio; CI, confidence interval. ||Significance level for the departures from Hardy Weinberg equilibrium (HWE) in the control samples. †OR of minor allele from 2x2 allele frequency table. ‡p Values derived from Cochran-Armitage trend tests. Chromosomal positions are from NCBI build 36.
Supplementary Table 6 The results of screening stage analysis of rectal cancer SNPs were ranked according to their p Value in the screening stage of rectal cancer. OR, Odds ratio; CI, confidence interval. ||Significance level for the departures from Hardy Weinberg equilibrium (HWE) in the control samples. †OR of minor allele from 2x2 allele frequency table. ‡p Values derived from Cochran-Armitage trend tests. Chromosomal positions are from NCBI build 36.
Supplementary Table 7 SNPs mapping to SLC22A3 along with p Value obtained from Cochran-Armitage trend tests OR, Odds ratio; CI, confidence interval. †OR of minor allele from 2x2 allele frequency table. ‡p Values derived from Cochran-Armitage trend tests. Chromosomal positions are from NCBI build 36.
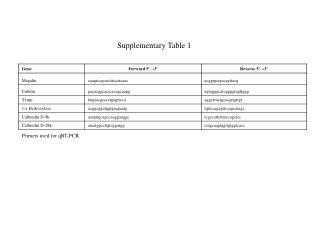
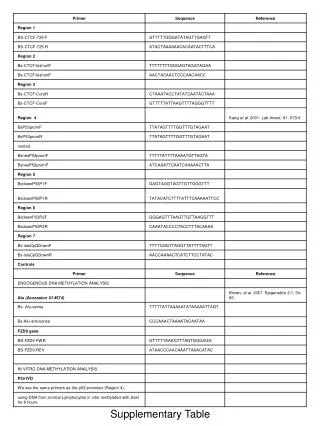
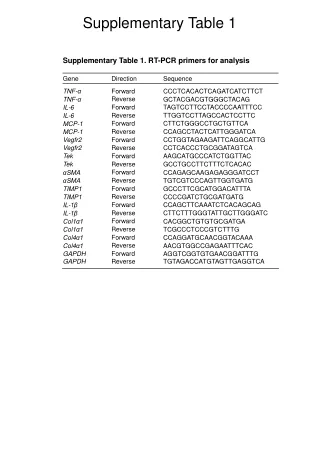
Supplementary Table 8 The results of previously reported loci in screening stage OR, Odds ratio; CI, confidence interval. †OR of minor allele from 2x2 allele frequency table. ‡p Values derived from Cochran-Armitage trend tests. || Minor allele frequency of control samples in the screening stage.¶ Minor allele frequency of healthy control samples in the screening stage. Chromosomal positions are from NCBI build 36. Supplementary Table 9 List of primers used for SNP discovery List of optimal primer sequences as designed with Primer3.
Supplementary Table 10 Results of replication studies and meta-analysis for colon cancerin Japanese OR, Odds ratio; CI, confidence interval. † OR of minor allele from 2 x 2 allele frequency table. ‡ p Values derived from Cochran-Armitage trend tests. § Result of Breslow-Day test. || Meta-analysis of all three studies. Odds ratio and p Values for independence test were calculated by Mantel-Haenzel method. Supplementary Table 11 Results of replication studies and meta-analysis for colorectal cancer in Japanese OR, Odds ratio; CI, confidence interval. † OR of minor allele from 2 x 2 allele frequency table. ‡ p Values derived from Cochran-Armitage trend tests. § Result of Breslow-Day test. || Meta-analysis of all three studies. Odds ratio and p Values for independence test were calculated by Mantel-Haenzel method.