Download
1 / 28
280 likes | 309 Views
Understand the science behind atmospheric composition and transport processes with advanced instruments in GEO-CAPE mission concepts. Explore local emissions, global impacts, and key atmospheric processes. Learn about innovative measurement techniques for better air quality forecasting.

E N D
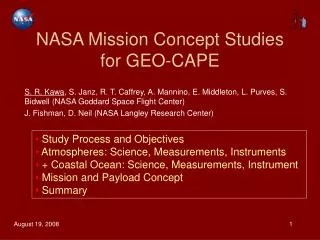
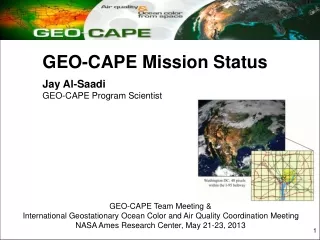
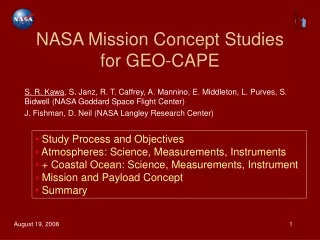
NASA Mission Concept Studies for GEO-CAPE S. R. Kawa, S. Janz, R. T. Caffrey, A. Mannino, E. Middleton, L. Purves, S. Bidwell (NASA Goddard Space Flight Center) J. Fishman, D. Neil (NASA Langley Research Center) • Study Process and Objectives • Atmospheres: Science, Measurements, Instruments • + Coastal Ocean: Science, Measurements, Instrument • Mission and Payload Concept • Summary
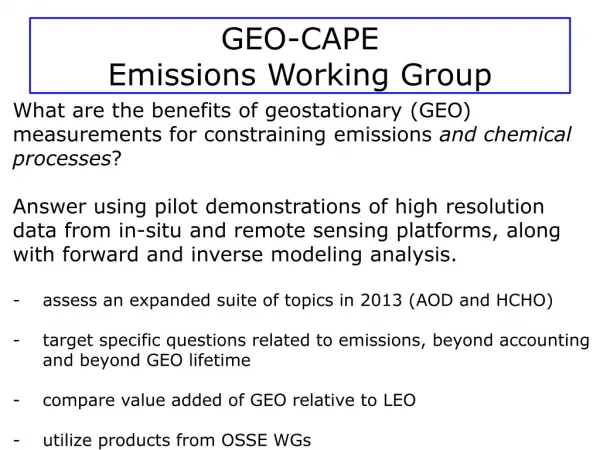
Overview of Study Process • HQ-commissioned Mission Studies (8 primary + 5 combined): • August 2006 to February 2007 • Motivation: prepare for recommendations of Decadal Survey • Objectives: identify science requirements, develop instrument and mission concepts, examine cost versus performance • Science working group, instrument synthesis lab, and integrated mission design studies for each • Products: design studies and summary reports
Relevant Mission Studies • 1) Geostationary Multi-spectral Atmospheric Composition (GeoMAC):atmospheric chemistry mission only, similar to GEO-CAPE atmospheres • a) moderate resolution scanning UV-Vis spectrometer (GSFC ISAL) • b) CO imager in solar infrared and thermal emission (LaRC IDC) • c) Imaging Fabry-Perot detector for near-surface O3 (IIP) • $850M • 2) Integrated Mission #5/Geostationary Multi-discipline Observatory (GMO):combines objectives of GeoMAC with coastal ocean (and terrestrial biosphere), corresponds closely to GEO-CAPE • a) and b) as above • c) very high-spatial resolution event imaging UV-Vis spectrometer (GSFC ISAL) • $1268M
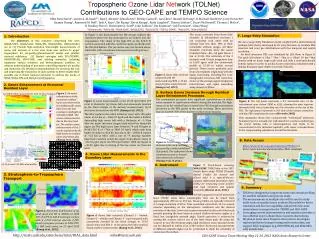
Science Overview: Local Emissions/Global Impact • Local and regional emissions impact ozone and aerosol on local to global scales. • Global changes in ozone, aerosol, and other pollutant species impact climate change and affect local air quality. [Ziemke et al., 2006] Tropospheric O3 from OMI and MLS (June ‘05 avg) • Better understanding of the key processes that connect global and local scales is required to accurately simulate, assess, and project these effects in the future. • GEO-CAPE is a mission to investigate the basic science of atmospheric composition and transport processes that underlie our ability to forecast air quality.
Elements of The (Atmospheric) Science Question Mission Science Questions Mission Science Objectives
[Bovensman et al., 2003] CO O3 NO2 SO2 NO2 Local Time (hr) [Bovensman et al., 2003] Why Geostationary Orbit: Temporal Resolution • Low earth orbit (LEO/sun sync) affords at best one sample per day at a given location in mid latitudes. Key processes occur on relatively short time scales that are not accessible from LEO observations. CMAQ Model Simulation of NO2 OMI Column Measurements Day 1 Day 2 Surface NO2 (ppb) Column NO2 (1015 mol. cm-2) June 22 Hour of Day (GMT) June 23 • Target continuous hourly sampling of key constituents
CO (ppbv) from MOPITT (June 21, 2005) Why Geostationary Orbit: Coverage and Spatial Resolution • Coverage:Once per day samples often obscured by clouds. • Spatial Resolution: - longer Geo time integration allows high SNR/ resolution element - higher spatial resolution improves chance of cloud-free pixel [Bucsela et al., 2006] Tropospheric NO2 from OMI for June 6, 2005 • Target 5 to 7-km pixel resolution over continental field of view. • Consistent with that anticipated for regional chemistry/transport models in the next decade. • Enable boundary layer O3 determination through cloud slicing • Potential to transform our understanding of atmospheric composition similar to the way GOES imagery has advanced weather analysis and forecasting.
MOPITT TES OMI TOMS GOME Increasing Tropospheric return Diurnal process studies GeoMAC Instrument Suite Concept • UV/Vis - Scanning UV/Visible spectrometer (300 – 480 nm); detect total column O3, NO2, HCHO, SO2, and aerosol; limited efficiency for O3 in the boundary layer. • CO Detector • Gas correlation filter radiometer measuring in reflected near-IR and thermal IR emission; senses atmospheric CO total column to surface and mid- and upper-troposphere weighted; separate boundary layer from free troposphere abundance. • Trop O3 - Imaging Fabry-Perot spectrometer for O3 in the thermal IR; sensitivity decreases near the surface more slowly than UV/Vis; determination of near-surface O3 in combination with UV/Vis. • Measurements all need to be made closely in time and space to enable detailed examination of transport and photochemical processes, e.g., O3 production from CO oxidation: CO + OH + O2 CO2 + HO2 HO2 + NO OH + NO2 NO2 + h + O2 NO + O3
Measurement Requirements and Instrument Suite Trace gas sensitivity required to meet science goals * Assumes PBL height of 1 km. Additional information on science requirements can be found at http://qp.nas.edu/QuickPlace/decadalsurvey/Main.nsf
Scanning UV/Vis Spectrometer Measurement Concept Calibration Assembly / Calibration Aperture Thermal Radiator • Measure atmospheric pollutants O3, aerosols, and precursors NO2, SO2, HCHO. • Field of regard: Western Hemisphere with emphasis on continental United State • Sample revisit time of 1 hour, during sun illumination. • Mission Design Life: 2 years, goal 5 years (consumables sized for 5 years), launch Sept. 2014. Star Tracker (1 of 2) 860 mm Gyroscopes 830 mm Optics Aperture and Scanning Mirror 1700 mm Optical Bench From ISAL Performance Data Technology Assessment / Development Needs • Single focal plane, continuous band from 300 nm to 480 nm. • Spectral resolution: 0.8 nm. • Signal-to-noise ratio of 720 at 320 nm and 1500 at 430 nm. • Typical scanned field-of-view: 8° N/S (5000km) x 8° E/W (5000 km). Can point anywhere on visible hemisphere. • Pointing stability maintained through active jitter compensation. • Sample spatial resolution 1.25 km N/S x 5.0 km E/W. • Measurement demonstration and technical feasibility completed under NASA Instrument Incubator Program. • No technical hurdles to instrument or spacecraft. • Pointing requirements are commensurate with GOES. • Detector optimization, single crystal silicon mirror testing, and aircraft demo recommended for technology readiness level 6.
Measurement Concept From LaRC IDC Carbon Monoxide Detector • Gas correlation filter radiometer measures CO in near-IR reflected sunlight and thermal IR emission. • Spectral combination approach identifies CO boundary layer distribution from space. • Measures CO, an atmospheric pollutant precursor of O3 and primary indicator of combustion. • Continue outstanding performance of MOPITT; scientific findings based on MOPITT data demonstrate the measurement maturity and technical feasibility. Dimensions: 1.31 x 0.55 x 0.43 m Instrument Performance Data Technology Assessment / Development Needs • Detector: Use of large format 2-D arrays in space (no scanning) • Data array: 1024 x 1024 pixels for each SWIR & MWIR • Spatial resolution: 5 x 5 km2; spectral resolution better than 0.1 cm-1 provided by gas filter. • Each spatial pixel requires frame averages to achieve SNR. • Onboard calibration: blackbody targets, deep space and solar views • Technology for this instrument is at high readiness level. • Measurement Heritage: MOPITT, HALOE • Beneficial investments: • - Radiation hard high performance electronics • - Light weight thermal control and structural materials
Multi-discipline Science Questions • What are the effects of gaseous and particulate emissions and climate variability and change on global atmospheric composition, and how will future changes in atmospheric composition affect ozone, climate, and regional/global air quality? • How are coastal ocean ecosystems and the biodiversity they support influenced by climate or environmental variability and change, and how will these changes occur over time? • What is the current geographical distribution, composition, and health of the terrestrial biosphere around the world, and how are its component ecosystems responding to climate changes? (from Strategic Plan, Sub-Goal 3A: 3A.1: Progress in understanding and improving predictive capability for changes in the ozone layer, climate forcing, and air quality associated with changes in atmospheric composition; 3A.3: Progress in quantifying global land cover change and terrestrial and marine productivity, and in improving carbon cycle and ecosystem models [NASA 2006]).
Coastal Ocean Spatial Resolution 250 x 500 km scan/15 min Sample coastal waters at 300-m resolution Measurement Objective:Ecosystem carbon, physiology and functional type with event scale multiple observations per day.
Chlorophyll CDOM(355) DOC A2006132 Ocean Ecological Products Critical products:Primary productivity, chlorophyll, particulate organic carbon, dissolved organic carbon (DOC), colored dissolved organic matter (CDOM), fluorescence line height, calcite, phytoplankton physiology and functional type (including harmful algal blooms).
Elements of the Science Question for Terrestrial Biosphere What is the current distribution and species or functional type composition of the major forest and grassland ecosystems and agriculturalsystems? What is the status of disturbance and fragmentation in these systems? What is the temporal variation in biogeochemical processes (e.g., transpiration, light use efficiency, nutrient uptake) that affect productivity in these ecosystems? How are terrestrial ecosystems affected by and responding to climate variability and change?
Imaging Spectroscopy for Terrestrial Biosphere
Washington, DC imaged with 5-km pixels. Observatory Concept Continuous scan of polluted regions • Combine instrumentation to enable coastal ocean and terrestrial biosphere science and enhance atmospheric science. • Combination of medium- resolution (5 km) continental scanning instruments with high-resolution (300-m) regional viewing spectrometer. • Very high spatial resolution, programmable geosynchronous multi-disciplinary observatory. • Shared resource for regular observations, special observing studies, and emergencies • Precursor designs in ESEI, COCOA, GEOCarb. • Meet or exceed discipline science measurement requirements. • Potential ground-breaking new science in each discipline plus synergies. Programmable high-resolution observations
4.5 m 3.0 m 1.2 m Multi Discipline Imager (MDI) Instrument Concept • Enable scientific objectives of coastal ocean, atmosphere, and biosphere. • Capable of pointing anywhere on visible Earth hemisphere. • Measurement parameters adjustable: dependent on science objective. • Employs three focal planes/bands • Two Si: 1k (spectral) x 2k (spatial) Rockwell hybrid focal plane • One HgCdTe: 256 x 2k Rockwell hybrid focal plane Instrument Performance Data Technology Assessment / Development Needs • Spectral Bands: 300-556, 340-1139, 1240, 1640 nm • Spectral Resolution: 0.75 (3x sample), 0.8, 40, 40 nm • SNR: > 1000 (bands 1, 2); > 500 (bands 3, 4) • Spatial Resolution: 300 m pixels, Coverage: 500 km • Temporal Resolution: < 1 hour • Mirror stabilization system for image generation will require further development to meet the required precision. • Large size drives cost, risk; need to optimize for science and feasibility.
Satellite Mission Concept Features UV/Vis Spectrometer CO Detector • Instrument Complement: MDI Ins, UV/Vis, CO Detector • Launch: ~FY2014 • Launch Vehicle: Atlas V 401 or Delta IV 4040-12 • Orbit Type • Geostationary • 100 Degree W Longitude • Real-Time Science Data Downlink with Dedicated Ground Station • Disposal into Geo + 300 km Parking Orbit Earth MDI Instrument Performance Data (with margins) Technology Development Needs • Mass: 1286 kg (payload), 4679 kg (observatory wet total) • Power (Average): 930 W (payload), 1625 W (total) • Data Rate: 120 Mbps (payload), 179 Mbps (total), • Spacecraft Pointing (1 sigma ): 30 arc-sec control, 4 arc-sec knowledge • Lifetime (years): 2 (design), 5 (goal & consumables) • SC Bus & Launch Vehicle • - None (over 20 geostationary launches/year) Est. Cost: $1.3B
Other Considerations Spacecraft and launch vehicle Advanced technology investments Ground system architecture Mission operations Cal/Val requirements, Validation program Supporting research and analysis International cooperation • No show stoppers
Outstanding Questions Can the mission be made more affordable? science requirements versus instrument performance/size Do instruments have to fly together? piggy-back on commercial communication satellite? Can other instrument concepts fulfill measurement requirements? cost, benefit, risk assessment Priority and feasibility of boundary layer O3 measurement? • Community input • Observing system simulation • Airborne demo measurements
Specifications • Instrument mass: 45-60 kg • Power: ~50 W • Cost: 12-20 Million (USD RY) • Optics: F/5 Cassegrain; all beryllium optics and structure; Offner Spectrometer • Focal Plane Array: Commercial visible detector • Length: 120 cm • Primary Mirror: 70 cm diameter • Secondary Mirror: 20 cm diameter • Performance • Spatial Resolution at Nadir: 200 meter • Spectral Resolution: 5 nm between 350 and 1050 nm (140 bands) • Signal to Noise: exceeding 400 between 400 nm and 900 nm Alternate Instrument Concepts Coastal Ocean Carbon Observations and Applications (COCOA) • Further Design Study
Summary • Strategic Concept: An Earth-viewing, Hubble-like programmable observatory facility. • Geostationary orbit enables continuous, frequent, high spatial-resolution observations required to provide the scientific foundation for quantitatively connecting local and global scales of pollution, coastal ocean, and land carbon. • new and unique approach to satellite remote sensing for atmospheric composition, coastal ocean properties, and the terrestrial biosphere • no major technological impediments • Need to work hard to make concept more affordable.
Option to Reposition Geo Longitude • Mission design study needed to determine drift rates, fuel load, ground communication requirements.
Science Working Group • Multi-Spectral Atmospheric Composition: P. DeCola (HQ, chair) S. R. Kawa (GSFC, Geo science lead) P. K. Bhartia (GSFC, LEO science lead) J. Crawford (HQ) E. Hilsenrath (HQ) M. J. Kurylo (HQ) H. Maring (HQ) W. H. Brune (Penn St U) D. Edwards (NCAR) M. Prather (UC Irvine) R. Prinn (MIT) A. Eldering (JPL) J. Fishman (LaRC) J. G. Gleason (GSFC) Additional acknowledgement to: J. Loiacono, B. Park, J. Herman, R. Knox (GSFC); J. Burrows (U Bremen); C. Bruce, M-E. Carr (JPL); G. Sachse (LaRC)
Terrestrial Vegetation Opportunity Scan forest at 300-m resolution (250 km)2 scan/15 min