Download
1 / 1
10 likes | 131 Views
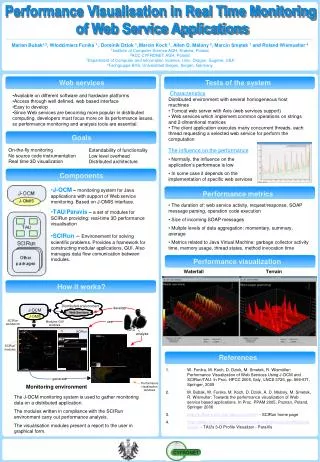
Distributed environment. develop. J. -. OCM. Web Services. J. -. OMIS. SCIRun. use. Modules’ GUI. workbench. windows. SCIRun. analyse. SCIRun. modules. generate. Performance. Monitoring environment. visualization. windows. Performance Visualisation in Real Time Monitoring

E N D
Distributed environment develop J - OCM Web Services J - OMIS SCIRun use Modules’ GUI workbench windows SCIRun analyse SCIRun modules generate Performance Monitoring environment visualization windows Performance Visualisation in Real Time Monitoring of Web Service Applications Marian Bubak1,2, Włodzimierz Funika 1 , Dominik Dziok 1,Marcin Koch 1, Allen D. Malony 3, Marcin Smętek 1 and Roland Wismueller 4 1Institute of Computer Science AGH, Kraków, Poland 2ACC CYFRONET AGH, Poland 3Department of Computer and Information Science, Univ. Oregon, Eugene, USA 4Fachgruppe BVS, Universitaet Siegen, Siegen, Germany Web services Tests of the system Characteristics Distributed environment with several homogeneous host machines • Tomcat web server with Axis (web services support) • Web services which implement common operations on strings and 2-dimentional matrices • The client application executes many concurrent threads, each thread requesting a selected web service for perform the computation • Available on different software and hardware platforms • Access through well defined, web based interface • Easy to develop • Since Web services are becoming more popular in distributed computing, developers must focus more on its performance issues, so performance monitoring and analysis tools are essential. Goals • The influence on the performance • Normally, the influence on the application’s performace is low • In some case it depends on the implementation of specific web services On-the-fly monitoring No source code instrumentation Real time 3D visualization Extendability of functionality Low level overhead Distributed architecture Components • J-OCM – monitoring system for Java applications with support of Web service monitoring. Based on J-OMIS interface. • TAU/Paravis – a set of modules for SCIRun providing: real-time 3D performance visualisation • SCIRun – Environement for solving scientific problems. Provides a framework for constructing modular applications, GUI. Also manages data flow comunication between modules. Performance metrics • The duration of: web service activity, request/response, SOAP message parsing, operation code execution • Size of incoming SOAP messages • Multple levels of data aggregation: momentary, summary, average • Metrics related to Java Virtual Machine: garbage collector activity time, memory usage, thread states, method invocation time Performance visualization Waterfall Terrain How it works? References • W. Funika, M. Koch, D. Dziok, M. Smetek, R. Wismüller: Performance Visualization of Web Services Using J-OCM and SCIRun/TAU. In Proc. HPCC 2005, Italy, LNCS 3726, pp. 666-671, Springer, 2005 • M. Bubak, W. Funika, M. Koch, D. Dziok, A. D. Malony, M. Smetek, R. Wismuller: Towards the performance visualization of Web service based applications. In Proc. PPAM 2005, Poznan, Poland, Springer 2006 • http://software.sci.utah.edu/scirun.html - SCIRun home page • http://www.cs.uoregon.edu/research/paracomp/tau/tauprofile/dist/paravis/ - TAU's 3-D Profile Visualizer - ParaVis The J-OCM monitoring system is used to gather monitoring data on a distributed application. The modules written in compliance with the SCIRun environment carry out performance analysis. The visualisation modules present a report to the user in graphical form.