Download
1 / 47
490 likes | 1.87k Views
China and India in Africa The making of the global hinterland Similarities between India and China High and sustained rates of growth of aggregate and per capita national income For longer in China than India, but growth accelerating in India recently

E N D
China and India in Africa The making of the global hinterland
Similarities between India and China • High and sustained rates of growth of aggregate and per capita national income • For longer in China than India, but growth accelerating in India recently • Occurs in the context of integration through trade, investment and financial liberalization • Increased presence in the global economy
Related to differences in structure of growth • Of the cumulative increase in GDP between 1991 and 2005, while 53 per cent was accounted for by industry in the case of China (with 40 per cent from services), as much as 62 per cent was accounted for by services in the Indian case (with 27 per cent from manufacturing). • Manufacturing growth strong in China accounting for 37 per cent of the increment in GDP in this period, whereas the comparable figure for India was just 16 per cent.
Implications of patterns of growth • Fall-out of growth led by manufacturing in China in terms of demand for non-manufacturing sectors, viz. agriculture, mining and services likely to be significant, if not strong • This is likely to impact on demand and growth within and outside China • This would not be as true of India’s services-led growth, which is likely to impact only on the demand for manufactures and other services
The evidence • A sharp shift away from imports from developed to developing countries starting in the mid-1980s in the case of China • The decline in imports from developed countries is true in the case of India too, though this is accompanied by a decline in imports from developing counties and an increase in unspecified categories.
Sources of China’s imports • In the second half of the 1980s, the sharp shift in the sources of Chinese imports was in favour of developing Asia • Subsequently, the increases have been distributed to other part of the developing world
Pattern of India’s imports • In India’s case, prior to liberalization, oil played an extremely important role in shaping the sources of imports. • With liberalization, Asia’s role as a source of imports has been increasing rapidly, servicing India’s manufactured import requirements. • Areas other than Asia, especially Africa, seem to be dropping out, but there is a data problem here.
Cumulative post-1990 growth of imports from Africa in dollar terms
Possible explanation • Growth based on manufacturing in China needs more access to raw materials, whereas growth based on services in India may generate more demand for oil and final manufactures. • China’s demand for primary raw materials including agricultural raw material and metals would be increasing.
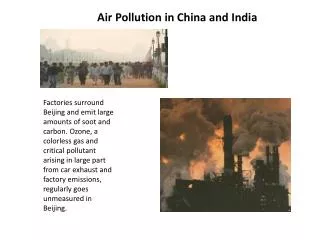
Impact on commodity prices • One major impact of the China boom has been a degree of buoyancy in commodity prices. While other factors have played a role, but for China’s presence, commodity prices may not have reflected the buoyancy they have. • Over the last five years there are signs of a reversal (however temporary) of the long term trend in global commodity prices. By the beginning of this decade commodity prices had fallen relative to consumer prices (as measured by the US Consumer Price Index) for over five decades. But from around 2002, commodity prices have been on the rise. • While exporters of oil have been important beneficiaries, the index of non-fuel commodity prices has also been rising.
Obvious importance of non-fuel commodities • Non-fuel commodities have a higher share in world trade (about 14 percent during 2000–04) than fuel commodities (7 percent). • Many developing countries are highly dependent on non-fuel commodities as a source of export earnings—36 countries have a ratio of non-fuel commodity exports to GDP of over 10 percent, and in 92 countries the ratio is over 5 percent. Indeed, in many low-income countries (including in Africa), a large share of export receipts is generated by just a few commodities.
Africa a major beneficiary • The major beneficiary of these trends in commodity demand and prices is Africa, in which China’s presence has expanded substantially. African exports to China started accelerating around 2000, and have since risen at an annual growth rate of more than 50 per cent. By 2004, African exports to China touched $11.4 billion, reflecting a more-than-threefold increase since 2000. By 2004 China accounted for 6 per cent of total African exports to the world.
Implications for Terms of Trade • One consequence of the rise in the volume and unit value of commodity exports from Africa, are signs of the reversal (for the present) of the long-term deterioration of net barter terms of trade faced by developing countries dependent on primary products for their export revenues that go to finance imports of manufactured products. • With competition in manufactures export trade (influenced by China) moderating price increases in manufactured goods, and China’s demand driving up commodity prices, developing countries as a group and Africa in particular that are still substantially dependent on the exports of primary products, have experienced an improvement in their terms of trade.
Net Impact on Africa • The net result of all this is that the China boom has helped a continent like Africa. • Real GDP growth in Africa rose from an average annual rate of 4.2 per cent during 2001-2004 from 3.3 per cent during 1997-2000. Sub-Saharan Africa gained even more with its real GDP growth rate touching 5.4 per cent in 2004, which was an eight-year high. • The African Economic Outlook 2005 (AfDB/OECD 2005), among others, attributes this improvement substantially to the rise in commodity prices. • Further China’s interest in the region’s natural resources has resulted in huge flows of aid and foreign investment from China to Africa, bolstering the regions infrastructure and putting much needed investment into the natural resources sector.
Is this a challenge to the old Imperialism • It is inasmuch as it gives other developing countries a space to negotiate the process of development • Africa still remains the hinterland, but: • With new partners other than the erstwhile colonial powers • On terms that are improving