Download
1 / 33
330 likes | 489 Views
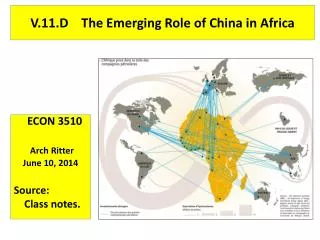
China and India: What’s in it for Africa?. Helmut Reisen, Andrea Goldstein, Nicolas Pinaud with the collaboration of Michael-Xiaobao Chen OECD Development Centre Prepared for Seventh Annual Global Development Conference Institutions and Development: At the Nexus of Global Change

E N D
China and India: What’s in it for Africa? Helmut Reisen, Andrea Goldstein, Nicolas Pinaud with the collaboration of Michael-Xiaobao Chen OECD Development Centre Prepared for Seventh Annual Global Development Conference Institutions and Development: At the Nexus of Global Change Pre-Conference Workshop on Asian and Other Drivers of Global Change January 18-19, 2006 Hotel Pribaltiyskaya, 14 Korablestroiteley Street, St Petersburg 199226, Russia
1. China and India Growth • contribution to global growth Table 1: China and India’s Contribution to Global Growth, 2000-2004 Percentage share of annual growth rate • Each year since 2001, their combined contribution to global output growth has been around 30 per cent. • Helped to hold global output growth above the 4 per cent threshold which is critical for improving the terms of trade for primary commodity producers. Source: IMF, World Economic Outlook, April 2005 N.B: GDP based on purchasing-power-parity (PPP) valuation of country GDP.
sources & structure • An analysis of the determinants of growth in China suggests that rapid growth should continue for the foreseeable future, albeit at a somewhat slower rate. • Thanks to capital accumulation (investment growth), potential growth in 2005 has reached 9.5 per cent. It is unlikely that the current savings rate (which has risen to 45 per cent of GDP) can be sustained in the long term. • But considerable room for further institutional and trade reforms to raise efficiency. • The continued re-allocation of labour from agriculture to manufacturing is a further source of productivity growth. Table 2: Sources of China’s Income and Output Growth, 1998-2003 -Percentage points- Source: OECD (2005)
Table 3: China and India’s Rising Energy and Steel Use Year-on-year growth rates (per cent) • The current process of capital deepening has spurred the drastic increase in both energy and metal use in China. • China has become the largest marginal consumer of many raw materials and energy products, benefiting raw material, food and energy providers in Africa, Australia and Latin America. • Indian energy and steel use also accelerates in the second period (2000-2003), although at are more moderate pace. Sources: China Statistical Yearbook (2004), International Energy Agency Data Service, Steel Statistical Yearbook (2004), International Iron and Steel Institute
China contributes to the raw material boom not just through the trade channel. • Global output growth is a major determinant for primary commodity prices; a recent estimate finds that world commodity prices move pro-cyclically with the growth rate of world industrial production, by about 1.5 percent for every one percent increase in world industrial output, with at most a one-quarter lag (Bloch et al. 2004). • If world industrial growth exceeds 4 percent, the barter terms of trade of primary commodity to finished goods prices rise. High global growth thus counteracts the Prebisch-Singer hypothesis that technological progress has led to a secular decline for raw commodity prices since World War II. • Lower US interest rates (which closely govern variations in global key interest rates) have a generally positive impact, partly because lower financial returns lead to an slower depletion of natural resource stocks, partly as higher output prospects and reduced storage costs lead to higher raw material prices. • Likewise, a drop of the US dollar will stimulate raw material prices, partly for the same reasons just evocated for the US interest rates, partly as a result of the dollar denomination of most commodity markets.
China contributes to the raw material boom not just through the trade channel. • Global output growth is a major determinant for primary commodity prices; a recent estimate finds that world commodity prices move pro-cyclically with the growth rate of world industrial production, by about 1.5 percent for every one percent increase in world industrial output, with at most a one-quarter lag (Bloch et al. 2004). • If world industrial growth exceeds 4 percent, the barter terms of trade of primary commodity to finished goods prices rise. High global growth thus counteracts the Prebisch-Singer hypothesis that technological progress has led to a secular decline for raw commodity prices since World War II. • Lower US interest rates (which closely govern variations in global key interest rates) have a generally positive impact, partly because lower financial returns lead to an slower depletion of natural resource stocks, partly as higher output prospects and reduced storage costs lead to higher raw material prices. • Likewise, a drop of the US dollar will stimulate raw material prices, partly for the same reasons just evocated for the US interest rates, partly as a result of the dollar denomination of most commodity markets.
Graph 1: Shares in world imports of selected primary commodities, China and India, 1998 and 2003 Source: UN Comtrade database • China’s and India’s demand for raw materials has been rising since the late 1990s. This exerts a growing upward pressure on prices , especially for those primary commodities that weigh heavily in Africa’s exports.
Table 4: China and India’s contribution to growth of world imports of selected commodities, 1998 - 2003 Sources: IEA database and UN Comtrade • Trade theory usually works with the small-country assumption: a country that engages in international trade faces given prices. But China (and for precious stones, India) has monopsony power in some raw material markets – its demand raises prices. In recent years, e.g., China has contributed all the world growth in demand for woods and cotton, and a third of global growth for oil and metals.
Graph 2: Africa[1]’s Trade with China and India, 1990-2004- Share of China and India in Africa’s Trade-[1] Data extraction based on 56 African countries including Northern African countries. Source: IMF Direction of Trade Statistics Both Africa’s exports to China and its imports from China have exploded in recent years. Trade with India has been less dynamic. Taken together, the share of the Asian Giants in Africa’s total exports has grown from 1 in 1990 to >12% in 2004. Trade between Africa and Chindia is roughly balanced.
Graph 3: Real GDP Growth in Africa, 1996-2004 Source: AfDB/ OECD (2005), African Economic Outlook. • So far, African growth seems to have benefited from China’s and India’s emergence, especially after 2000. • Sub-Saharan Africa’s real GDP growth rate reached 5.4 percent in 2004, an eight-year high. A critical factor behind Africa’s growth momentum has been commodity prices and export volumes. • Many African economies are prominently linked to the world economy as raw material producers, hence they are important to Asian import demand.
Graph 4: Annual percentage change in commodity import prices, 1994-2004 -US$ per Kg- Source: UN Comtrade Unsurprisingly: prices have been rising since 2001. Prima facie, this is good for raw material producers.
Graph 6: China and India as Net Importers of Commodities Relevant to Africa China's Net Imports India's net imports Graph 6 visualises the wild swings in net imports by the two Asian giants for oil, metals, wood and cotton, those commodities that weigh most importantly for Africa’s foreign exchange receipts.
Table 5: Volatility in Commodity Prices Relevant to African Countries • The benefits of China’s and India’s rising global demand (net imports) for Africa-relevant commodities are attenuated by the volatility of demand of the Asian giants, partly due to cyclical variations but also to arbitrage between home production and imports. • Moreover, as about 70-80 percent of manufacturing exports from China is produced by multinational corporations, high raw material demand partially reflects relocation of raw material demand from production sites elsewhere. • Such relocation does not occur without friction, which further fuels demand volatility. Consequently, rising raw material demand from China and India is not necessarily an unfettered blessing for Africa, to the extent that it represents relocation and goes along with higher volatility of demand. Note: * Standard deviation of monthly percentage changes Source: Own calculations based on World Bank data
Table 6: Terms of trade variability and effects on GDI, 1997-2003 Table 6 presents estimates for the variability of terms-of-trade and UNCTAD calculations for the effects of changes in the terms of trade on Gross Domestic Income (GDI) for each country and each group from 1997 to 2003. Between 1997 and 2003, the GDI effects were greatest in the oil-exporting African countries, where terms of trade variability and export concentration are the most distinct. The average annual gain or loss of income initiated by terms of trade movements amounted to more than 7 percent of GDP. Figures are much lower for the other two categories of African exporters, but still positive. Notes: * Standard deviation of the annual rate of change of the net barter terms of trade ** UNCTAD calculates the average annual impact of terms of trade changes on GDI (Gross Domestic Income) as a percentage of GDP (Gross Domestic Product), in absolute value, 1997-2003, as the difference between the growth rates of GDI and GDP in real terms. GDI is the sum of all income earned in the domestic production of goods and services, while GDP measures the total market value of goods and services produced domestically during a given period. Source: UNCTAD (2004), Handbook of statistics.
Graph 7: Terms of Trade, Export Volumes and Purchasing Power of Exports in Developing Economies, by Region,1980-2002(index numbers, 2000=100) Africa’s barter terms of trade rise, Asia’s drop since the late 1990s. Income terms of trade rise in both regions.
The rapid export growth of low-skill and labour-intensive manufactures has increased the market competition for these goods and hence exerted a downward pressure on their prices. While the relative decline in the export prices of low-skilled manufactures has generally been associated with considerable volume growth, declining export prices for primary commodities are typically associated with lower volume growth, due to the much lower price elasticity of demand. Africa’s income terms of trade have benefited from Asia’s emergence, through a net rise in the demand for Africa’s raw commodity supply should translate into higher export unit prices; and urban consumers gain from cheap consumer goods sourced from the Asian Drivers, and African investors from cheap and appropriate capital goods. Graph 8: Declining World Manufacturing Export Price, 1986 – 2000 Source: Kaplinsky (2005)
Africa’s Trade Reorientation towards the Asian Drivers Graph 9: The Reorientation of Africa’s Exports Towards the Asian Drivers African Exports to Industrialised Countries (% of total) The industrialised-country export share of major African raw and soft commodity producers (Angola, Burkina Faso, Chad, the two Congo, Nigeria, Sudan and Zambia) has dramatically receded over the same period while China has taken over as a major market for these countries. Chinese imports from selected African countries show a very clear pattern in terms of commodity structure which is consistent with the latter’s Ricardian advantage in commodity production . Extractive commodities and forestry in particular make up the bulk of African exports to China. Labour-intensive agricultural and manufactured goods do not feature significantly in the exports of any of the selected African countries to China. African exports to India are much more diversified and labour-intensive than those to China. Cotton accounts for a significant share of Cameroon’s (76 percent) and Sudan’s (72 percent) exportsto India.
Graph 10: Trends in Diversification of selected African Countries1998 / 2002 - Herfindahl index* Africa’s trade redirection towards China and India could derail the endeavors by African commodity producers to diversify away from traditional exports and push them back into commodity dependence Notes: * The diversification indicator measures the extent to which exports are diversified. It is constructed as the inverse of a Herfindahl index, using disaggregated exports at 4 digits (following the SITC3). A higher index indicates more export diversification ** Include Botswana, Lesotho, Namibia, South Africa and Swaziland. Sources: African Economic Outlook 2004/2005, based on African Development Bank Statistics Division ; PC-TAS 1998-2002 International Trade Centre UNCTAD/WTO - UN Statistics Division
The term “Dutch Disease”, coined by The Economist in 1977, originated in the Netherlands after the discovery of North Sea gas. The reference paper is Corden and Neary (1982)[1]. Corden (1984)[2] points out that a resource boom can take place in three ways: first, there can be exogenous technological progress in the booming resource sector; second, the country can see a windfall discovery of some natural resources; and third, there can be an exogenous rise in the world price of a natural resource exported by a country. The third case is of interest in the context of the Asian giants’ emergence in the world economy. [1] Corden, Max W. and Peter J. Neary (1982), “Booming Sector and De-Industrialisation in a Small Open Economy,” Economic Journal, vol. 92, no. 368, pp. 825-48. [2] Corden, Max W. (1984), “Booming Sectors and Dutch Disease Economics: Survey and Consolidation”, Oxford Economic Papers, Vol. 36., pp. 359-80. Dutch Disease, Leamer Triangles and China Table 7: Real Effective Exchange Rates ( 2000 = 100) Year 1977-2001 2002 2003 2004 • There was real effective currency appreciation in some African countries, regardless of the exchange-rate regime adopted; either the Euro appreciated against the US dollar and hence led to real appreciation in CFA countries, or raw material prices translated into real appreciation elsewhere.
Graph 11: Dutch Disease and IS-LM Before China’s emergence, Africa is at point A. In the IS-LM textbook model, a Dutch Disease boom shifts the aggregate demand curve IS to the right to IS’. This puts upward pressure on the interest rate, which in turn triggers capital inflows. With a fixed exchange rate, money flows in through the balance of payments, allowing full accommodation to the increase in demand for domestic output, at point M. The real exchange rate appreciates as a result of higher domestic inflation. If the central bank wishes to keep the money supply fixed, it has to abandon the exchange rate peg. The currency appreciates far enough to return the trade balance, the IS curve, and Y to the starting point, A.
Graph 12: Dutch Disease with Two Export Items • The core model of Dutch Disease economics assumes a small open economy with three sectors – two traded good sectors, one booming (commodities) one lagging (manufactures), with prices given internationally; and one non-traded sector, with prices determined by domestic demand and supply. A resource boom affects the economy through the resource movement effect and through the spending effect. Rising commodity prices raise the marginal product of labour in the booming sector, ensuing a shift of labour to the booming sector, away from manufactures (resource movement). The boom also leads to an increase in income and to higher demand for all three goods. With the price of tradables set on world markets, the extra spending raises the absolute and relative price of nontradables, resulting in appreciation of the real exchange rate. In response, labour shifts to the nontradable sector from the non-booming tradables, which contracts (spending effect).
The combined effect of the resource movement effect and of the spending effect will produce the following effects on the economy: • Production in the manufacturing sector falls; • Manufacturing exports drop; • The real exchange rate appreciates; and • Nontraded output expands if the spending effect is strong than the resource movement effect; this is likely in those countries where the mineral rents are spent on public services and construction. For the Dutch Disease to arise in Africa and become a serious policy issue, however, a number of conditions must be met: • First, there must indeed be other sectors for which the rise in the real exchange rate would create competitiveness problems; on the face of it, manufacturing and agricultural processing are underdeveloped in Africa compared to other non-OECD regions. • Second, it remains to be seen whether the favourable tendency in Africa’s terms of trade are sustainable rather than transitory.
Table 8: Trade Ties with China and India and Corruption in Africa • Most raw material rich African countries receive low scores in the perception of corruption and bribery as reported by Transparency International. This might suggest that any increased presence of the Asian giants in the resource rich countries may increase the rents earned by an elite that commands access to those resources, rather than by the population at large. The exploitation of exhaustible resources might therefore not only burden current, but also future, generations if the proceeds are not invested at a social return high enough to exceed the inter-temporal shadow cost. • It should be noted (see Table 10), however, that the transparency scores, although low, have not deteriorated during recent years when the presence of the Asian giants became more visible in Africa.
Foreign Direct Investment • Direct Competition for FDI Projects (MFA, AGOA, EBA): Textiles, Furniture,Generics • Production Complementarities (Asia yes, Africa less) • Asian Oil-FDI to Africa : subsidised capital cost • Standards & Codes: Bribery of Public Officials, Extractive Industries Transparency Initiative • Chinese Presence on the Ground
For further information: www.oecd.org/dev