Download
1 / 64
640 likes | 690 Views
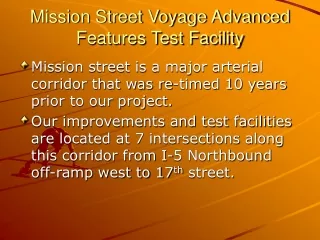
Mission Street Voyage Advanced Features Test Facility. Mission street is a major arterial corridor that was re-timed 10 years prior to our project. Our improvements and test facilities are located at 7 intersections along this corridor from I-5 Northbound off-ramp west to 17 th street.

E N D
Mission Street Voyage Advanced Features Test Facility • Mission street is a major arterial corridor that was re-timed 10 years prior to our project. • Our improvements and test facilities are located at 7 intersections along this corridor from I-5 Northbound off-ramp west to 17th street.
InboundAM OutboundPM
Prior to improvements Mission street travel times were from 8 to 11 minutes each direction during peak periods. • Post installation of Voyage Stage 2.0 found travel times to be 4 to 4.5 minutes each way an reduction of 50-60%.
This project was originally conceived as a proof of product test facility for NWS Advanced Voyage firmware Features and 2070 controller training. • With the help of NWS, cooperation of the City of Salem, Region 2, TSSU, members of the VUG (Voyage User’s Group), and ODOT electrical crews, this project was taken from concept to reality. • Beginning in January of 2010 ODOT placed new 2070 controllers on the street.
The test project was designed to proceed in logical stages. • Stage 1.0 used the original 170 timing. • Some minor revisions were made to allow for beginning of main street green as the reference point. • Additional time was added for Ped. Walk/FDW and phase Red/Yellow transitions to meet current standards.
From the beginning we found that the installation of straight line conversions yielded nearly 20% improvements to operations, volume through put and the travel times with an overall reduction in delay for the entire system. • This was believed to be due to the inclusion of POM (ped. override mode) and the fact that the 2070’s get into step from transitions quicker than the 170’s.
The next phase of the operation stage 2.0 used Synchro to model optimized timing splits and coordination plans. • Lots of plans! 17 to be exact an entire library that covers the entire day M-F plus weekends. • Fact is we only have 8 basic plans to produce. These 8 plans are then ‘cloned’ to produce remaining plans.
The actual base plans or ‘Host’ plans serve as just that, hosts to their respective clones or ‘Guest’ plans. • Host plan 8 serves the morning heavy plan ‘Triad’ and has two ‘Guest’ plans. Plans 7 and 9 which are exact copies of the Host plan. • This saves time and will allow the population of the plans library in very short order. • Later in stage 2.2.1 we will make appropriate adjustments to critical movement splits in guest plans that will better use the limited cycle length to the fullest without causing transitions or adjustments in the off-sets or cycle lengths.
The last comment is the most important to this concept. • Voyage uses the same cycle length and off-set for the guest plans as that of the hosts. • This means no transitions between plans and a smooth re-allocation of cycle time to serve needy phases.
With the plans library was populated with host and guest plans designed to cover the various traffic conditions through the day we activated transparent PPS and SVO operations. This allowed us to collect appropriate v+ko data from the background without activating the advanced operations features on the street.
Guest Plans are located above and below Host plans as shown with 4,6,7,9,11,13,14, and 16 Plans Library Host Plans are 5,8,12, and 15
So how do we identify those needy phases we discussed? • Stage 2.0 the start of Voyage advance features operations. • In this stage we set up master system detection. • One of the primary steps to development of Voyage Proactive Plan Selection and Split Variant Operations. • This step is critical in the operations and will require some sound judgment and observations.
Two outbound master system detectors Inbound flow Outbound flow Two outbound master system detectors
Two outbound master system detectors Inbound flow Outbound flow
Two inbound master system detectors Two outbound master system detectors Two inbound master system detectors Outbound flow Inbound flow
With our initial placements of these detectors we found many issues. • Our second placement had better results for the inbound systems but, found the outbound to be questionable.
Two inbound master system detectors Two inbound master system detectors Three outbound master system detectors Inbound flow Outbound flow
Our third attempt, Stage 2.1, Placed the outbound master system detection at the phase 2 approach lane to Hawthorn. • This placement resulted in improved data. • Allowed us to move to the next phase of the test operations.
Outbound Master system detectors Three outbound master system detectors placed at a single location provided smooth and consistent V+ko values.
Stage 2.2.1 (currently fully activated) plan selection with Proactive Average, and Split Variant inbound or outbound operations. • In the next slide we see a typical v+ko and plan selection log as provided by the master system logs in Voyage.
With this detection layout we capture the fluctuations that occur in the morning rush and can make appropriate adjustments to the normal operational splits that the host plan or medium plan is using. • As you can see at 7:45 there is a significant rise in the v+ko values. • The system responds nearly as quickly as the rise in the values and is prepared for the in flow of the added traffic. • Once the event passes the system makes a quick adjustment to the lower host plan and then to the low volume guest plan.
We can see this event in the graph that shows the relationship of the v+ko values and the plan selection. Due to the scale of this graph and short preparation time you can not see the lower graph line of the plan selection but, in the previous plan you can see the relationship of these values.
The previous and following slides show the relationship between plans, their start and stop times, and the threshold v+ko values that drive selections. • I’m currently working to build an Excel tool that will allow us to use the raw data from the controller with plan overlays, optimized target volumes, and start / stop times of each operation. • The tool should allow us to graphically select v+ko threshold values appropriate to the operations. • Even without the this tool we can see the relationship of these thresholds.
In this slide you can see that the v+ko values for the morning operations have levels that will keep the system operational in the primary host plan until such time as the v+ko values drop or rise above the operational parameters of this host plan. • In the case of the time after 9:30 we see that we can shift some of the split time from a major phase and use that time in the minor phases.
Synchro Optimizations determined cycle lengths. • In this process I found that if I build plans that correspond to the appropriate host and guest plans for each of the target values could determine high, med. and low operation limits. • These models currently need to be revised, the volume data for the each intersection and re-run the simulations. • Data used was a copulation of several days and times of the year and then used that growth factor to inflate or deflate these values for the models as they stand today.
With the data provide by Voyage MOE logs we can track the areas of concern. • Use these measures to determine the extent of improvement gained by the adjustments we make along the way. • Each intersection has a story to tell and areas that will either identify problems and/or optimal use of the green times for the intersection at a glance. • The following slides illustrate this concept and show the relative improvements gained with the activation of the advanced feature operations.
Given the relative ease of this process and the level of improvement we can make major improvements across the state. • Very good results with any or all of these features. • Proactive Average is probably the most useful out of the box feature. • Split Variant Operations can gain estimated 5 to 10 percent improvement for short term conditions through the day. • Other features can be added to these features to further improve performance. • Are there any questions?