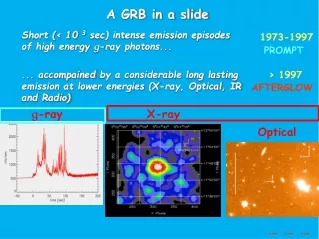
Advanced Simulation Framework for Gamma-Ray Bursts Using GLAST and BATSE Data
160 likes | 299 Views
This document outlines a comprehensive simulation framework developed for analyzing Gamma-Ray Bursts (GRBs) based on GLAST (Gamma-ray Large Area Space Telescope) and BATSE (Burst and Transient Source Experiment) data. It covers simulation methods, models, and sensitivity studies, showcasing how GRB fluxes are generated and analyzed through Monte Carlo techniques. The framework employs a high-level simulator, utilizing the fireball model for spectral analysis, enabling the generation of a simulated GRB catalog consistent with observed distributions. Key tools like SpectObj and the Band model facilitate the simulation's integration with LAT software.

Advanced Simulation Framework for Gamma-Ray Bursts Using GLAST and BATSE Data
E N D
Presentation Transcript
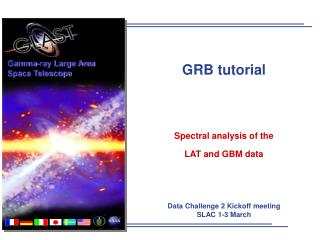
GRB simulations in GLAST Nicola Omodei INFN Pisa
Outline • Simulation, framework, models • GRB simulated “catalog” (From BATSE to LAT) • Example of LAT GRB sensitivity studies • Conclusions
GLAST LAT Full Simulation • C++ code, GAUDI skeleton. • Flux generation = beams, test distribution, cosmic rays distributions, celestial sources (including transient GRB sources) • Montecarlo based on GEANT4 • Fast science simulator (observationSim) based on IRF
GRB simulators: the basic idea • High level simulator. • The basic idea is to describe the spectrum (Nph/cm2/kev/s) as a function of the energy (keV) and time (s) (stored in a two dimensional histogram - TH2D) • SpectObj provides common tools for interfacing the models with the LAT software (via flux) • SpectObj applies also the EBL attenuation (L.C. Reyes, J.McEnery) to GRB spectra • GRB physical model: based on the fireball model (colliding shells, shocks dynamics, acceleration of electrons, Synchrotron and Inverse Compton emission) • GRBobs model: distributions from BATSE observations, spectrum parameterized with the Band model and extrapolated to high energy. • GRBtemplate reads the spectrum from an ASCII file (easy accommodate different models). Pulsars (Max Razzano)
GLAST/GRB Simulations Phenomenological approach Parameters from observed distributions (BATSE) Different GRB light curves can be obtained. Fluxes are normalized to the BATSE observed fluence distribution (BATSE catalogue) LAT flux is obtained extrapolating the BATSE flux at LAT energies. LAT photons are extracted from the predicted flux and processed by the GLAST/LAT Software [Full Montecarlo or parameterized (fast) Sim] Flux in the GBM energy range fed the GBM simulator and GBM signal is obtained Physical approach Fireball model (Piran,1999) Shells emitted with relativistic Lorentz factors Internal shocks (variability naturally explained) Acceleration of electrons between with a power law initial distribution, between min and max Non-thermal emission (Synchrotron and Inverse Compton) from relativistic electrons Other model can be accommodated in our simulators Hybrid thermal + power law model (Felix Ryde & Mlan Battelino)
The DC2 model: the GRB phenomenological simulator • Original IDL code from Jay Norris • Pulse shape: double exponential shape, “pulse paradigm” • FWHM, rise time, decay time, “peakedness” (Norris, 96) • Pulses combined accordingly with a “bimodal” distribution • Interval between pulses and interval between “events of pulses” • Band model spectral shape, Ep drawn from the Preece et al. 2002, for each pulse • Combined with the pulse shape gets a time evolving time HE LE
GRB 080207 • Output: • Combined spectrum • Well fitted by the Band model • Combined light curve • LAT Sky Map • NaI [10 keV, 1 MeV] • BGO [150 keV,30 MeV] • LAT > 20 MeV
GRB global properties • How do we can generate thousands of GRBs in agreement with the observations? Fluence Peak Flux Duration (T90) alpha, beta, Ep Redshift Random generation of parameters Simulated GRB catalog
Simulated catalog Duration [s] Peak Flux50 300[ph/cm^2/s] • Each burst is in agreement with the BATSE observation • Redshift distributions from theory • High energy spectrum is a simple extrapolation to LAT energy • EBL absorption (Primack Bullock, 2005) • The position of the bursts is random in the sky alpha Beta SFR (Porciani & Madau ‘01) Binary Mergers (Fryer ‘99)
Comparison with data • Comparison with the BATSE catalog: • Bimodal distribution in duration and fluences for long and short bursts • Fluence - Duration correlation
Data Challenges Data Challenges are massive Montecarlo data production, starting from a sky model, obtaining “scientific” data, ready to be analyzed with official GLAST science tools! Full observation, instrument, and data processing simulation. Team uses data and tools to find the science. “Truth” revealed at the end. • A progression of data challenges. • DC1 in 2004. 1 simulated week all-sky survey simulation • DC2 (March-May 2006). 55 simulated days all-sky survey.
… the Data Challenge II Bursts… • Red stars: GBM trigger (~ 200 burst/yr) • Blue stars: not triggered • “Back of the envelope” calculation: • LAT more than 1 counts: 23 bursts (113 burst/yr) • LAT with more than 5 couns: 14 (69 bursts/yr) • LAT with more than 10 counts: 9 (44 bursts/yr)
Computing the LAT sensitivity with more statistics (1 yr simulation) • Assuming: • 650 GRB/yr over the 4 pi • Extrapolating the spectrum from BATSE to LAT • Simulating one year of observation (obsSim) • EBL model from (Primack, Bullock, 2005) • Results: • Number of LAT counts for each bursts LAT counts Burst Id
Computing the LAT sensitivity with more statistics (1 yr simulation) • Assuming: • 650 GRB/yr over the 4 pi • Extrapolating the spectrum from BATSE to LAT • Simulating one year of observation (obsSim) • EBL model from (Primack, Bullock, 2005) • Results: • Number of GRB/yr vs LAT counts Studies on the GRB detection algorithm: sensitivity to 5 collected counts: ~ 70 burst (>5 counts, >30 MeV)
Conclusions • Gamma-Ray Bursts sources are available in GLAST software. • GRB are point source with a complex temporal profile, broad band spectra, time evolving. • Simultaneously generated GBM and LAT data. • Experienced the Data Challenges • Massive Montecarlo production, many sources simulated together for “a” realistic sky • Studying the bursts sensitivity • “Simplest” assumption: extrapolating from BATSE to LAT (5 orders of magnitude!) • 100 burst/yr with more than 1 count • ~70 burst /yr with more than 5 counts • Other models can be included (cut-offs, SSC emission) • Optimized IRF can give higher GRB yield.