Download
1 / 22
220 likes | 317 Views
This document summarizes advancements in gamma-ray burst (GRB) simulations conducted in the DC2 framework, highlighting the collaboration of experts including Valerie Connaughton, Nicola Omodei, David Band, Jay Norris, and Felix Ryde. Key activities include the generation of data for both LAT and GBM instruments, detailed spectral analyses, and the fitting of various GRB models. Insights into the physical characteristics of GRBs, ranging from their intensity and duration metrics to modeling techniques, are discussed, providing a comprehensive overview of ongoing GRB research endeavors.

E N D
GRB Simulations in DC2 Valerie Connaughton with input from Nicola Omodei, David Band, Jay Norris and Felix Ryde.
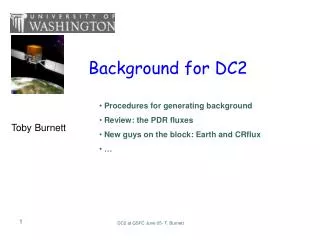
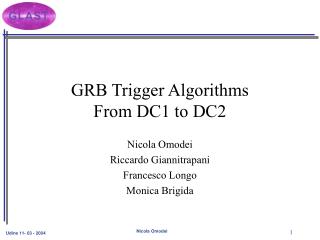
Current GRB Activities • Generation of LAT GRB data –Nicola Omodei • Generation of GBM data – David Band using burst definition and spectral parameter history input from Nicola. Produces TTE, DRM, background data and CTIME and CSPEC in our Level 1 FITS format according to ICD. • Analysis of LAT data to extract GRB pha2 and rsp files – Nicola • Fitting of spectra with XSPEC – Nicola and David • Production of limited TRIGDAT – mostly to notify participants to presence of burst in LAT data – Valerie (+ Rob Preece) • Modelling of GRBs – Nicola, Jay Norris, Felix Ryde • Deciding what kind of bursts – models, numbers, realistic Log N-Log P, “interesting” events -- are included – ???
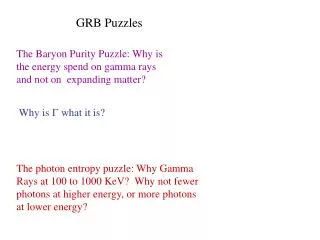
GRBs at BATSE energies Bursts are varied in: • Duration. • Intensity (Peak Flux). • Number, width, separation of peaks. • Fluence. • Spectral characteristics. Over the large ensemble of BATSE GRBs (2704) these parameters allow us to characterize the GRB population at energies up to ~ MeV.
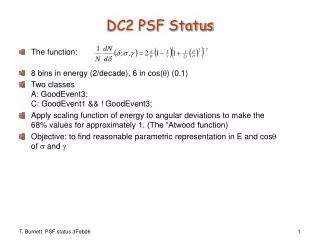
GRB characteristic distributions Typical GRB spectrum characterized at BATSE energies by the Band parameterization α, β, A, Epeak or some similar function where the physical meaning of these parameters is not specified.
GRB characteristics at LAT energies Band parameterization α, β, Epeak Duration drawn from T90 (with ¼ short) Peak flux drawn from BATSE distribution Pulse width scaled with energy to LAT energies W(E)=W0 E-0.333 Number and spacing of pulses according to Norris et al 1996.
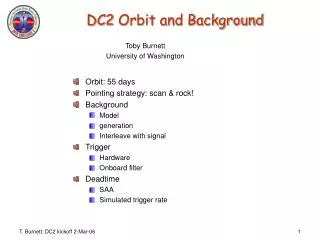
GRB physical model • Shells emitted with relativistic Lorentz factors • Internal shocks (variability naturally explained) • Acceleration of electrons with a power law initial distribution, between min an max • Non-thermal emission (Synchrotron and Inverse Compton) from relativistic electrons
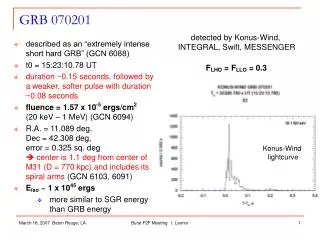
Reconstructed c.o. 5.5±1.5 GeV G=220±60 Simulated GRB with c.o. at 4.5 GeV Due to the finite value of the Lorentz factor of the accelerated electrons, the synchrotron spectrum presents a cut-off at LAT energies. This cut-off is simulated by the GRB physical model. Xspec spectral fitting Root fit Reconstructed c.o. ± GeV G=± Simulated GRB with c.o. at 4 GeV
-18 - 14s 14 - 47s 47 - 80s 80 - 113s 113 - 211s GRB High-Energy Measurements High-energy (> tens MeV) might be delayed, sometimes persistent beyond BATSE range, might fall above extrapolation of β inferred from lower-energy spectrum.
Synchrotron Model Synchrotron + Inverse Compton Reconstructed photons! Inverse Compton emission The Inverse Compton emission (SSC) is parameterized by a parameter, which is the ration between the Synchrotron peak and the Inverse Compton peak of the vFv spectrum. A simplified spectral shape is used in order to reduce the computational time (synchrotron spectrum shifted by m2 plus an exponential cut-off due to conservation of energy. Band Function: “best” representation of the GRB flux between 20 keV and 1 MeV High energy photons (>50 MeV)
Hybrid Thermal/NonThermal Spectrum • Felix Ryde & Milan Battelino provide the N(e,t) ASCII file, describing the spectrum from their model. • GRBtemplate reads the ASCII file, and create a TH2D object • SpectrObj computes fluxes, fluences, and extracts photons for the LAT simulation.
Extraction of photons • The energy is randomly extracted from the integrated spectrum E(t,e). • The “real” algorithm is more sophisticated! (I.e. taking into account interpolation between bins)
SpectrObj and the extraction of photons GRBSim Low Energy (GBM, BATSE) Light Curves High Energy (LAT) Light Curves Simulated GRB Fv Spectra Band Fv Spectrum Extracted HE Photons
Simulated GRB from LAT Outputs events and S/C data for whole Event and for GRB Region. Also, PHA and RSP files For XSPEC. Outputs GBM Definition and Spectral Parameters file.
XSPEC result for simulated burst Input spectrum, alpha=0.4, beta=2.25 XSPEC result from LAT data, beta=2.311 +/- 0.1637 with reduced chi2 0.5
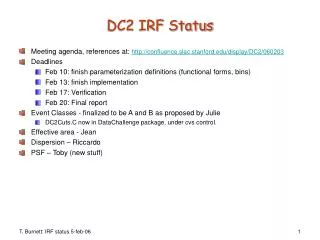
DC2 preparation, new features • Burst can be generated inside a given FoV. • Burst are generated randomly in time (not as in DC1!) • Improvement of the GRB physical model: cut-off, IC. • GRB phenomenological model redesign. • New ‘class’ model implemented: GRBtemplate is able to accommodate any GRB model (it reads a file from someone else!) • GBM synchronization!!
Production of GBM Data Products • Goal: Production of simulated GBM data products in the appropriate format (see data products talk Wednesday morning) consistent with simulated LAT bursts. • David Band created a system of IDL procedures to create these GBM data products. • This system does not worry about earth occultation, nor does it have any burst physics. • Input: • Burst name (for file names, headers, also source of date) • Burst time (assumed to be the same in the LAT data) • Burst location in spacecraft coordinates (to calculate response) and celestial coordinates (for file headers) • Time series of spectral parameters (every 16 ms). This is the input of the burst model.
Production of GBM Data Products, cont. • Output (a file for each burst-facing detector): • Time tagged events • Response matrices—direct component only • Background spectra • Rates for trigger 4000 s in two versions with different spectral and temporal resolution • Rates for day with burst • The spacecraft is assumed to maintain constant orientation during the burst (i.e., no autonomous repoint). • The GBM response and background models were provided by Marc Kippen a few years ago, and are therefore preliminary. The response does not include scattering off the Earth’s atmosphere.
Production of GBM Data Products—Methodology • The background and response matrices are calculated using Marc Kippen’s IDL procedures. • Source and background counts are created • Random source photons and background count arrival times are generated assuming Poisson statistics and the count rates • Energies are assigned to the generated photons and background counts by sampling from the source and background spectra • The source photons are ‘detected’ (i.e., some are kept and some are thrown out) using the response matrices • The counts are binned in time into count rates. • All data are written out in properly formatted FITS files.
GRB Analysis procedure in DC2 TRIGDAT (RA/DEC) (Time) Extract LAT event data, pointing/livetime and IRF from GRB position/time info GRB spectral catalog GRBs in LAT Sky map Event binning, DRM gen, Likelihood Feed GBM & LAT data to XSPEC/RMFIT for joint spectral fit. Bin GBM TTE data to same resolution as LAT