Download
1 / 30
320 likes | 491 Views
Extreme sea level drops in the western tropical Pacific— Causes, coastal impacts, and future projections. Matthew J. Widlansky International Pacific Research Center In collaboration with: Axel Timmermann (IPRC) Mark Merrifield (JIMAR, UHSLC) Shayne McGregor (UNSW Sydney)

E N D
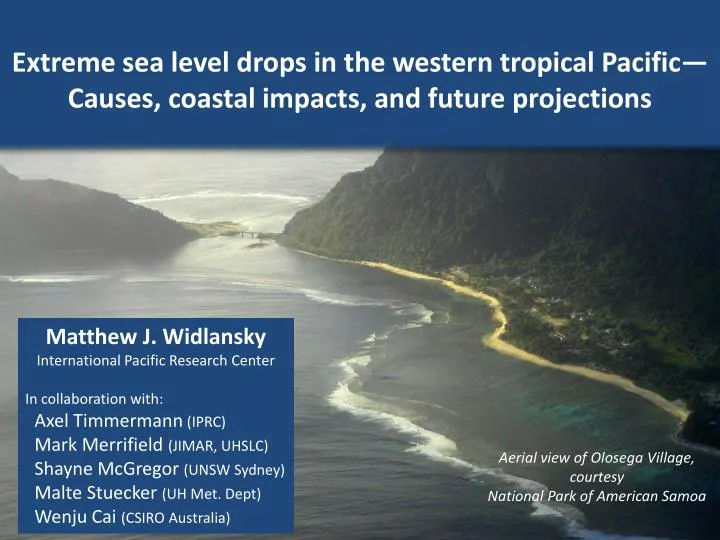
Extreme sea level drops in the western tropical Pacific— Causes, coastal impacts, and future projections Matthew J. Widlansky International Pacific Research Center In collaboration with: Axel Timmermann (IPRC) Mark Merrifield (JIMAR, UHSLC) Shayne McGregor (UNSW Sydney) MalteStuecker(UH Met. Dept) WenjuCai(CSIRO Australia) Aerial view of Olosega Village, courtesy National Park of American Samoa
During strong El Niño events, sea level drops around some tropical western Pacific islands by up to a foot (30 cm) Samoans call these events ‘taimasa’ (pronounced [kai’ ma’sa]) in reference to the foul smelling tide caused by coral die-offs Future extreme low sea level events may become more frequent
Snapshot of a key climate feature South Pacific Convergence Zone (SPCZ) Image from 8 February 2012 MTSAT-2 visible channel, Digital Typhoon, National Institute of Informatics
Recent literature on the SPCZ (Widlansky et al., 2013 Nature Climate Change)
Underlying SST gradients influence the SPCZ Observed rainfall and SST climatology during DJF (mm day-1) 26°C 28°C NOAA SST GPCP rainfall • Tropical SPCZ adjacent the meridional SST gradient (equatorial) • Subtropical SPCZ transects the meridional SST gradient (mid-latitudes) and is west of maximum zonal SST gradient (e.g., Lindzen and Nigam, 1987 J. Atmos. Sci.) (2011 Climate Dynamics)
Interannual variability of the SPCZ Observed rainfall and SST climatology during DJF (mm day-1) Extreme El Niño 26°C 28°C El Niño La Niña NOAA SST GPCP rainfall (2011 Climate Dynamics)
Extreme zonally oriented SPCZ event: 4 January 1998 GMS-5 IR water vapor 6.70-7.16 μm Some islands experienced droughts while others more tropical cyclones Ron (Tonga: 67% damaged) Susan (125 kts) Katrina (28 days) In Samoa, prolonged low sea levels exposed shallow reefs
Tide gauge observations (tropical western Pacific) UH Sea Level Center data Interhemispheric sea level seesaw (r = 0.60) at lag 6 months Very low sea levels, or ‘taimasa’, affect South Pacific islands mostly during strong El Niño events (Widlansky et al., in review)
Shallow reef response to sea level variability Normal conditions El Niño Taimasa d > h d < h Top portions of coral heads die off, creating what are known as microatolls(e.g., Woodroffe and McLean, 1990 Nature) Flat top Porites coral photo courtesy National Park of American Samoa
Wind-stress variability associated with ENSO Equatorial Pacific (10°S-10°N, 100°E-60°W) wind stress anomaly (McGregor et al., 2012 J. Climate) 26% 15% • 3 highest peaks of PC1 classified strong El Niño events, matching lowest sea levels in the Southwest Pacific • PC2 abruptly switches from negative to positive, especially after 1982/83 and 1997/98 El Niño peaks
Regressions: Sea surface height and wind stress Zonal sea level gradient Meridional sea level gradient Canonical sea level response to El Niño (e.g., Wyrtki, 1984 JGR) Most pronounced during strong El Niño (e.g., Alory and Delcroix, 2002 JGR) Equatorially symmetric wind stress pattern associated with ENSO (Stuecker et al., 2013 Nature Geoscience) Southward shifted westerly wind anomaly east of Dateline (McGregor et al., 2012 J. Climate) Shading: Sea surface height (ECMWF ORAs4) Vectors: Wind stress (ERA interim) Blue contours:Negative wind-stress curl (SH cyclonic) Vectors: Wind stress (ERA interim) Contours:Wind-stress curl (negative, SH cyclonic) Vectors: Wind stress (ERA interim) Shading: Sea surface height (ECMWF ORAs4) Tide Gauge Stations: (UHSLC)
Regressions: Near-surface current anomalies reverse Zonal sea level gradient Meridional sea level gradient Strengthened Equatorial Counter Current, drainage of West Pacific Warm Pool (e.g., Wyrtki, 1984 JGR) Current anomalies reverse, sea levels return to normal in northwestern Pacific Sea levels remain depressed south of 5°N; i.e., the meridional seesaw. (Alory and Delcroix, 2002 JGR) Shading: Sea surface height (ECMWF ORAs4) Vectors: Near-surface current, 5–56 m average (ORAs4)
Regressions: SPCZ collapses equatorward Zonal SPCZ events are associated with prolonged extreme sea level drops (PC1 & PC2 > 0) Shading: Rainfall (GPCP) Blue contours: Pacific rainbands enclosed by 5 mm d-1 rainfall annual climatology
Asymmetric western Pacific sea level response r = 0.74 at lag 3 months
Combination-mode: ENSO (fE) + Annual Cycle (1) Near-annual combination tones appear in PC2 of surface winds (Stuecker et al., 2013 Nature Geoscience) & western Pacific sea level gradient ~15 months ~9 months 2–7 years
Shallow-water model (1.5-layer) hindcast simulations ‘Zonal seesaw’ of tropical Pacific thermocline depth and sea levels associated with ENSO ‘Meridional seesaw’ characterized by 9 and 15 month spectral energy (Wang, Wu, & Lukas, 1999 J. Meteorol. Soc. Jpn.)
Combination-mode and prolonged sea level drops Southwest Pacific PC2 experiment forced with the southward westerly wind shift —essentially nonlinear interaction between annual cycle & ENSO— sufficient to prolong below-normal sea levels
PC2 correlated with central Pacific sea level Correlation with observed sea surface height Central Pacific r = 0.73 at lag 1 month
Key Points • Extremely low sea levels—capable of damaging shallow coral reefs—persist long after termination of strong El Niño events in the tropical southwestern and central Pacific. • Sea level drops are related to interaction of El Niño with the forced annual cycle and associated seasonal development of the South Pacific Convergence Zone. • Hindcast experiments suggest potential predictability of future extreme sea level drops once El Niño has developed to a certain intensity threshold. How will strong El Niño events and extreme sea level drops respond to climate change?
Recent work by Cai & coauthors… (Nature 2012) Observed climatology (1981–2005) Shading: Rainfall (GPCP) Blue contours: Rainfall > 5 mm d-1 Green contours: Warm pool > 27.5°C Red line: Zonal SPCZ position CMIP5 projection (2074–2098 minus 1981–2005) RCP8.5 W m-2 (31 models) Blue contours: CTRL Rainfall > 5 mm d-1 Green contours: CTRL Warm pool > 27.5°C Shading: Warming Vectors: Surface wind change
Defining a“zonal SPCZ event”: PC1 > 1 and PC2 > 0 GPCP rainfall Zonal SPCZ La Niña Second principal component Neutral Moderate El Niño First principal component
CMIP5 projections Considering only models able to simulate nonlinear behavior of the SPCZ (12 out of 31 models) Climate Change? Number of zonal SPCZ events increases from Control to Climate Change period
Meridional SST gradient & zonal SPCZ events Observed rainfall and SST climatology during DJF (mm day-1) Box 1 26°C 28°C Box 2 ~ GPCP rainfall ~ NOAA SST 1997/98 El Niño = [Box 1 SST – Box 2 SST]
Smaller future meridional SST gradient Maximum equatorial warming is a robust response to greenhouse warming (e.g., Xieet al., 2010 J. Climate) Box 1 Box 2 SST trend pattern (departure from tropical mean) 21st century projection (RCP 4.5 W m-2, 20 models) Pacific island communities experience extreme weather–droughts or floods, tropical cyclones, & sea level drops– during zonal SPCZ events
Simulated sea surface heights MIROC5 ocean-atmosphere GCM Southwest Pacific 21st century projection? *very preliminary (1 model/1 run) RCP 4.5 Southwest Pacific
Should future increased frequency of El Niño Taimasa occur, a higher likelihood of prolonged low sea level events is perceivable Plans for further study: Simple shallow-water ocean model Hindcast experiments to confirm seasonal predictability of El Niño Taimasa events Use a sophisticated coupled ocean-atmosphere model (e.g., NCAR CESM) Future simulation from one model 2) Assess changing frequency of El Niño Taimasa Examine ensemble of CMIP5 future climate change experiments Sketch outline of a reef flat • 3) Biogeographic characterization of near-shore reef and community relevance • Compile bathymetric data • Partner with coral experts to determine growth behaviors in response to sea level variability
Last idea: Simulate shallow reef growth & decay Normal conditions El Niño Taimasa (d > h) = 1 (d < h) = 1 Parametric coral model Height change Growth Decay or erosion Coral growth constraints: Water temperature below critical temperature (Tc– T)… warming Aragonite saturation state (arag)… ocean acidification Water depth above coral (d – h)… tides, El Niño, & sea level rise Non-branching coral (Porites) Species specific parameters: Growth rate constant (0) Height dependent growth function (f) Decay rate of exposed coral () Collaborate with coral experts to simulate future reef vulnerability caused by climate extremes & communicate “Taimasa threat index”
Matthew Widlansky mwidlans@hawaii.edu http://iprc.soest.hawaii.edu/users/mwidlans/ Thank you
Increased number of zonal SPCZ events Flux adjusted perturbed physics experiments with HadCM3 model (12 out of 17 experiments considered) 2 1 Greenhouse warming is likely to cause: More summers with small meridional SST gradients 2) Increased frequency of zonal SPCZ events