Download
1 / 58
590 likes | 729 Views
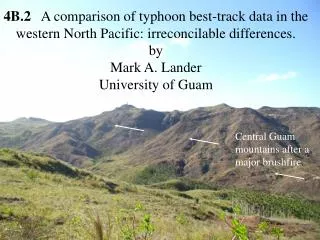
The Monsoon Circulation, Typhoon Activity, and Island Rainfall in the Western North Pacific During the Past 50 Years: Recurring Patterns and Extreme Events Mark A. Lander Water and Environmental Research Institute of the Western Pacific. Central Guam mountains after a major brushfire.

E N D
The Monsoon Circulation, Typhoon Activity, and Island Rainfall in the Western North Pacific During the Past 50 Years: Recurring Patterns and Extreme Events Mark A. Lander Water and Environmental Research Institute of the Western Pacific Central Guam mountains after a major brushfire.
Pohnpei locator maps showing world setting and Pohnpei Island with Municipalities.
Climate Change? Who ya gonna believe? Me, or your own eyes? * My own rules of thumb: Warwick Rhode Island 1960s, 1970s First touch of frost: Last week of September First hard freeze: Last week of October First day max temp < freezing: Last week of November These events now occur 2 or 3 weeks later !! * Groucho Marx
Climate change during my lifetime Global Warming Global Cooling
Climate Variability in USAPI during the past 50 years • Very large year-to-year changes Annual Rainfall on Guam 50 inches to 150 inches • Tropical Cyclones WNP Basin annual number: 20 to 40! • ENSO • Monsoon flow pattern
Weather makers in USAPI • Tropical Cyclones • Monsoon trough • TUTT/TUTT Cells • ENSO • Mesoscale Convective Systems If you’re going to change the climate of Micronesia you have to change the climate of these !
Climate of Pacific Islands1500 years BP to now(MWP through LIA to current) Problems: • No direct measurements, none that go back more than 100 years (50, at best in many locations)! • Proxy records conflicting, and yield some almost inexplicable local climate and climate changes (e.g., Washington Island).
Question for Group • Can one use very recent global temperature behavior as proxy for larger and longer transitions: e.g., MWP to LIA? -- Investigate positions of ITCZ and rainfall on Washington Island before, during and after the “Time Magazine Ice Age” -- 1988 very cold La Nina-related cold water What did it do to ITCZ?
1988 had very cold equatorial waters. Check position of ITCZ 1988
Summer Monsoonof the western North Pacific Normal surface flow pattern (black = westerly) VS 1997 (dashed-line filled = westerly).
Summer Monsoon Palau Surface wind flow, August 1997
Strongest Westerly Wind Burst ever Observed ! (December 1996)
1 2 The MJO Put the only heat source of the entire planet over the Maritime Continenent: Easterly winds would extend across the whole Pacific, Atlantic and to East Africa. Westerlies would extend across the Indian Ocean.
Reverse-oriented Monsoon Trough W
Super Typhoon Paka (December 1997) When low latitude winds go westerly, clouds and rain are found in max west wind band and in associated TCs. Majuro W.I.
Question for Group: • How much was this flow pattern changed by past 1500-year climate changes and how much can it be changed by anticipated global warming? • Location of STR, monsoon trough, TUTT, typhoon tracks • ENSO effects • Large-scale features similar even in Permian!!
Question for Group: • Washington Island bone dry? • There would almost have to be a cold tongue (i.e., not major El Nino like all the time). • Christmas Island also dry? • Then ITCZ must either be most of the time in the Southern Hemisphere, or ITCZ is pushed to the north of W.I. for much of the year. (check on 1988 – a year with an extensive cold tongue). • Meteorological “Equator” currently at 7 North!! • Palau now dry only because of El Nino (+1) and during typical September when the monsoon trough moves well to the north.
Micronesia Rainfall in a Warmer World 1998 HNL conference: Reduction in mean annual rainfall from shift in ENSO * More El Nino Like most of the time * More Large El Nino’s
Southern Oscillation IndexRunning Sum 1983 Catastrophic flooding In the Marquesas Eastern Micronesia Deadly Typhoon 1992 Micronesia-wide Severe Drought 1998
Pacific Interannual and Interdecadal Variability • There is ONLYENSO. Time series is autoregressive (several months) with stochastic forcing. Spectral Peak at ~ 2.6 years. • Pacific Decadal Oscillation is reddened ENSO. Time series and fields are similar, but with longer memory because of mid-latitude mixed-layer deepening.
Question for Group: • Has ENSO been affected by climate changes in the past 1500 years? Frequency, strength, character • ENSO affects almost everything in USAPI: Tropical cyclone distribution, rainfall, sea level, monsoon trough position, and extreme events of weather elements.
ENSO 1998 Climate workshop East-West Center Consider ENSO in a warmer world: More frequent strong El Nino’s like 1982-83 and 1997-98? or Climate more El Nino-like all the time? Question: Is this the model for the past 1500 years? (MWP and LIA ??)
Extreme Value Analysis IDF chart of selected return periods at the SIA (blue dots connected by blue dashed lines). Because the cause of the extreme events is typhoons, this curve may be considered applicable for all of Saipan. The intensity-duration values measured during Typhoon Pongsona on Guam (red dots connected by red dotted line) are shown. Also, the highest Intensity-duration values measured by a newly installed rain gauge network on Pohnpei have been plotted (green dots connected by green dotted line). Without typhoons, the return-periods at all durations would be much lower.
HEAVY RAINFALL IN A TYPHOON Max = 175 mm/hr
Questions for Group: • How have past 1500-year climate changes affected rainfall in USAPI? • Can USAPI extreme rainfall events be affected by global climate changes such as MWP, LIA and anticipated AGW? • Do typhoons produce the highest rain rates at all intervals: 15 minute to 24 hour?
Questions for Group: • Is the overall rainfall in the tropics heavier in a warmer world? * • * I have outstanding bet with Bob Livezy regarding Singapore rainfall over the past 50 years. • Or, are only the values of extreme rainfall elevated in a warmer environment? • e.g., Trenberth’s claim of Katrina 7% more rain because of AGW • Every cloud affected? Or just typhoons? (The Katrina Effect)
Tinian WMO WMO International International Workshop on Workshop on Rota Tropical Tropical Cyclone Cyclone Landfall Landfall Guam Processes. Processes. Macao, China. Macao, China. (21 (21 - - 25 March 25 March 2005) 2005) SUNDAY MORNING, 8 December 2002 M. Lander M. Lander Slide 16 Slide 9
Western North Pacific Tropical Cyclone Variability Active Quiet Quiet Active