Download
1 / 1
10 likes | 87 Views
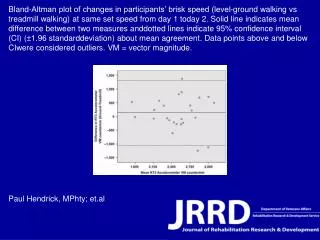
Bland-Altman plot comparing participants' brisk speed changes from day 1 to day 2, showing mean difference and 95% confidence interval. Outliers above/below the CI are identified. Study by Paul Hendrick, MPhty et al.

E N D
Bland-Altman plot of changes in participants’ brisk speed (level-ground walking vs treadmill walking) at same set speed from day 1 today 2. Solid line indicates mean difference between two measures anddotted lines indicate 95% confidence interval (CI) (±1.96 standarddeviation) about mean agreement. Data points above and below CIwere considered outliers. VM = vector magnitude. Paul Hendrick, MPhty; et.al